3 Cockburn Environmental Data
3.1 Background and Context
CSIEM seeks to integrate a diverse range of data from various origins and providers in order to allow the Cockburn Sound models developed to be informed and integrated with the best available data and science. However, the many types of data, such as weather, hydrologic, water quality, or ecological data, and the fact that the data spans many decades, creates a challenge to effectively organise the entire data-set in a robust, repeatable and transparent way. Several of the key data-sets are managed by different agencies who each use their own technical frameworks and standards for data organisation, and many other data-sets remain in an unorganised form, so intgerating all the diverse datasets requires development of a common set of metadata standards and reliable data processing workflows. Providing this coordination to bring data-sets together is referred to as data federation.
Data that is relevant for the management and modelling of Cockburn Sound comes from national data collection programs, state agency environmental monitroing programs, local companies and organisations, various initiatives within the research community. These datasets are all critical for understanding the Cockburn Sound ecosystem and form the foundation of the CSIEM system. Beyond simply organising data, the needs of the modelling requires data in a consistent format (e.g. units, terminology, data structure, etc), to allow for effective model-data integration as is required during the model set up, validation and reporting phases. With this regard, workflows have been developed to organise and store both field observational data and model data in a consistent way. The details of CSIEM data organisation are described in this chapter (Chapter 3), and the methodology for model-data integration is described in Chapter 4.
This Chapter summaries a synthesis of the various data sources into a standard, CSIEM Environmental Information Management framework that sets out standards and workflows. This framework is needed to :
- Support a federation of datasets, and
- Document the standards used to organise observational and modelled data, using a flexible metadata and workflow setup
This will provide:
- Standards for data users,
- Compiled data products for ease of use,
- An entry point for new data generators who want to add new data products, and
- A way to facilitate model and data integration for CSIEM model assessment, visualisation and analytics.
3.2 Relevant data management initiatives
Various information management activities are currently active and relevant to Cockburn Sound Environmental Management. These include:
- Microsoft Azure Blob Storage
- WAMSI GIS Portal
- WAMSI Sharepoint
- Pawsey Acacia Storage
- BMT Sharepoint
- DWER Water Information Reporting system
- DOT Coastal Data system
- Other 3rd party data facilities (e.g. BOM, IMOS etc)
An overview and relevant links of the key related initiatives are listed below.
Azure Blob Microsoft Azure Blob Storage
The Azure Blob Storage was set up by Westport as a location for WAMSI Westport Marine Science Program data to be stored, and in some cases, historical data. This storage option is suitable for medium to large sized data (1 - 100GB) e.g., raster bathymetry data. Access to the Azure Blob Storage is available to Westport staff and selected WAMSI Theme 10 data team members. Data and reports will become accessible for viewing and downloading only to all involved in the WAMSI Westport Marine Science Program and Westport Office through links with the WAMSI GIS portal.
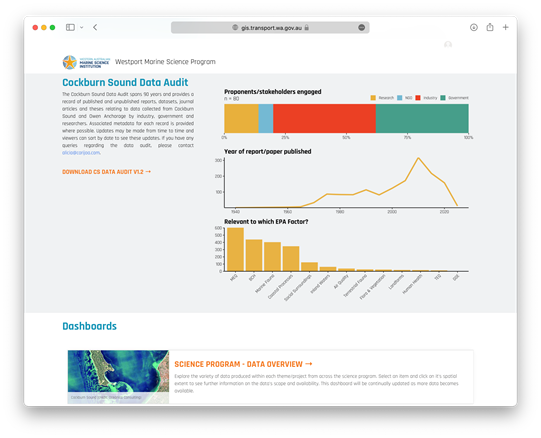
Figure 3.1: Microsoft Azure Blob storage.
WAMSI GIS WAMSI GIS Portal
The WAMSI GIS Portal is a Westport ArcGIS managed website that acts as a navigation centre for researchers accessing commonly requested datasets and documents, both historical and provided under the WAMSI Westport Marine Science Program. The home page is intended to provide summary information and search functionality and will be the default landing page when researchers log into their Westport ArcGIS accounts. Information such as the most up to date Cockburn Sound data audit, Theme 10 workshop slides and Westport Technical Standards can be found here. Contrary to appearance, the WAMSI Portal does not ‘host’ data - rather, it provides searchable listings that link to data and reports stored on one of the four data stores: Westport SDE (Spatial Database Engine), Azure Blob Storage, WAMSI Sharepoint (mentioned above), Pawsey Acacia Storage.
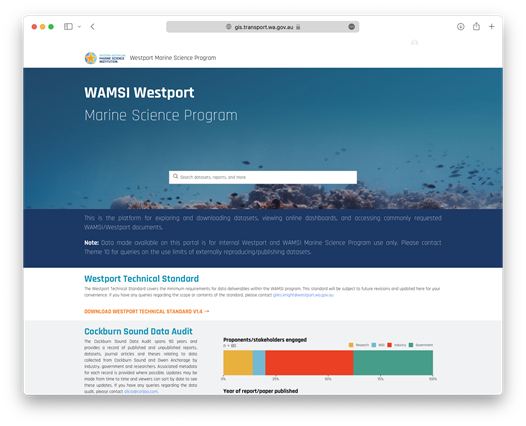
Figure 3.2: WAMSI GIS portal.
WAMSI Sharepoint WAMSI Westport Reports and Data Sharepoint
WAMSI set up a Microsoft Sharepoint page to store historical Cockburn Sound data and reports acquired from proponents. Some of the data and reports and copied across from the BMT Sharepoint page, and others are obtained outside of BMT. Small datasets collected under the current WAMSI Westport Marine Science Program may also be stored here. The data and reports are sorted under a folder structure with the first folder division being ‘Open access use’ or ‘WAMSI Westport use’. Data and reports are then organised by proponent/organisation -> year -> report title. Document and folder URLs from the WAMSI Sharepoint will be linked to the WAMSI GIS portal to become searchable by WAMSI Westport Marine Science Program researchers and the Westport Office. The WAMSI Sharepoint is currently accessible to WAMSI staff and selected Theme 10 data team members, and will become accessible (view and download only) to all involved in the WAMSI Westport Marine Science Program and Westport Office through links with the WAMSI GIS portal.
Figure 3.3: Microsoft Sharepoint storage.
Acacia Storage Pawsey Acacia Storage
The Pawsey Acacia Storage is intended for the largest of datasets (100s-1000s GB) sourced from external proponents or the WAMSI Westport Marine Science Program e.g. Theme 5’s ROMs oceanography model output. Access to the Pawsey Acacia Storage is available to Westport staff and selected WAMSI Theme 10 data team members. Data is restricted for viewing and downloading to those involved in the WAMSI Westport Marine Science Program and Westport Office through links with the WAMSI GIS portal.
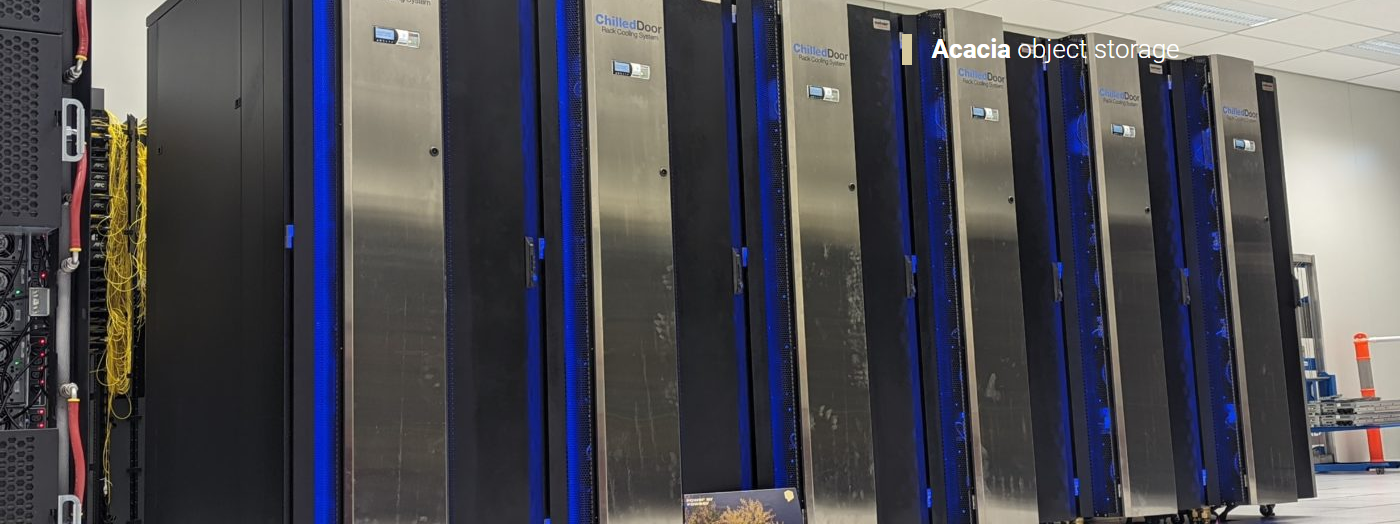
Figure 3.4: Pawsey Acacia storage.
BMT Sharepoint BMT Cockburn Sound Data SharePoint
BMT Commercial Australia Pty Ltd (BMT, previously Oceanica) is a large and established consultancy that monitors and collects marine and coastal data within Cockburn Sound for a variety of proponents, particularly Fremantle Ports, Water Corporation and Cockburn Cement Limited. BMT was engaged by WAMSI as they hold proponent’s data and are best placed to share data with WAMSI once sharing permissions are received from proponents. BMT set up a Microsoft Sharepoint page that contains a catalogue of reports and data held by BMT, data sharing license agreements from proponents, and requested reports and data related to the data sharing license agreements. WAMSI then migrates the approved reports and data across to a WAMSI Sharepoint. Access to the BMT Sharepoint has been provided to selected Theme 10 data team members and BMT staff. BMT also set up restricted access folders within the BMT Sharepoint for major proponents to easily review their reports prior to giving access to WAMSI. WAMSI Theme 10 data team members can not access these restricted proponent folders.
DWER WIR DWER Water Information Reporting & Cockburn Mooring Data
…
3.3 CSIEM Environmental Information Management
The goal of the CSIEM Environmental Information Management framework, as presented herein, is to allow compatibility, inter-operability and between crticial data assets, and version control as is required for the development of a comprehensive and integrated modelling platform.
The framework can be viewed as three separate systems:
- Data Collation
- Data Governance & Reporting
- Data Integration
The relationship between the various iniatives, the CSIEM Environmental Information Management framework, and downstream model applications are outlined schematically in Figure 3.5.
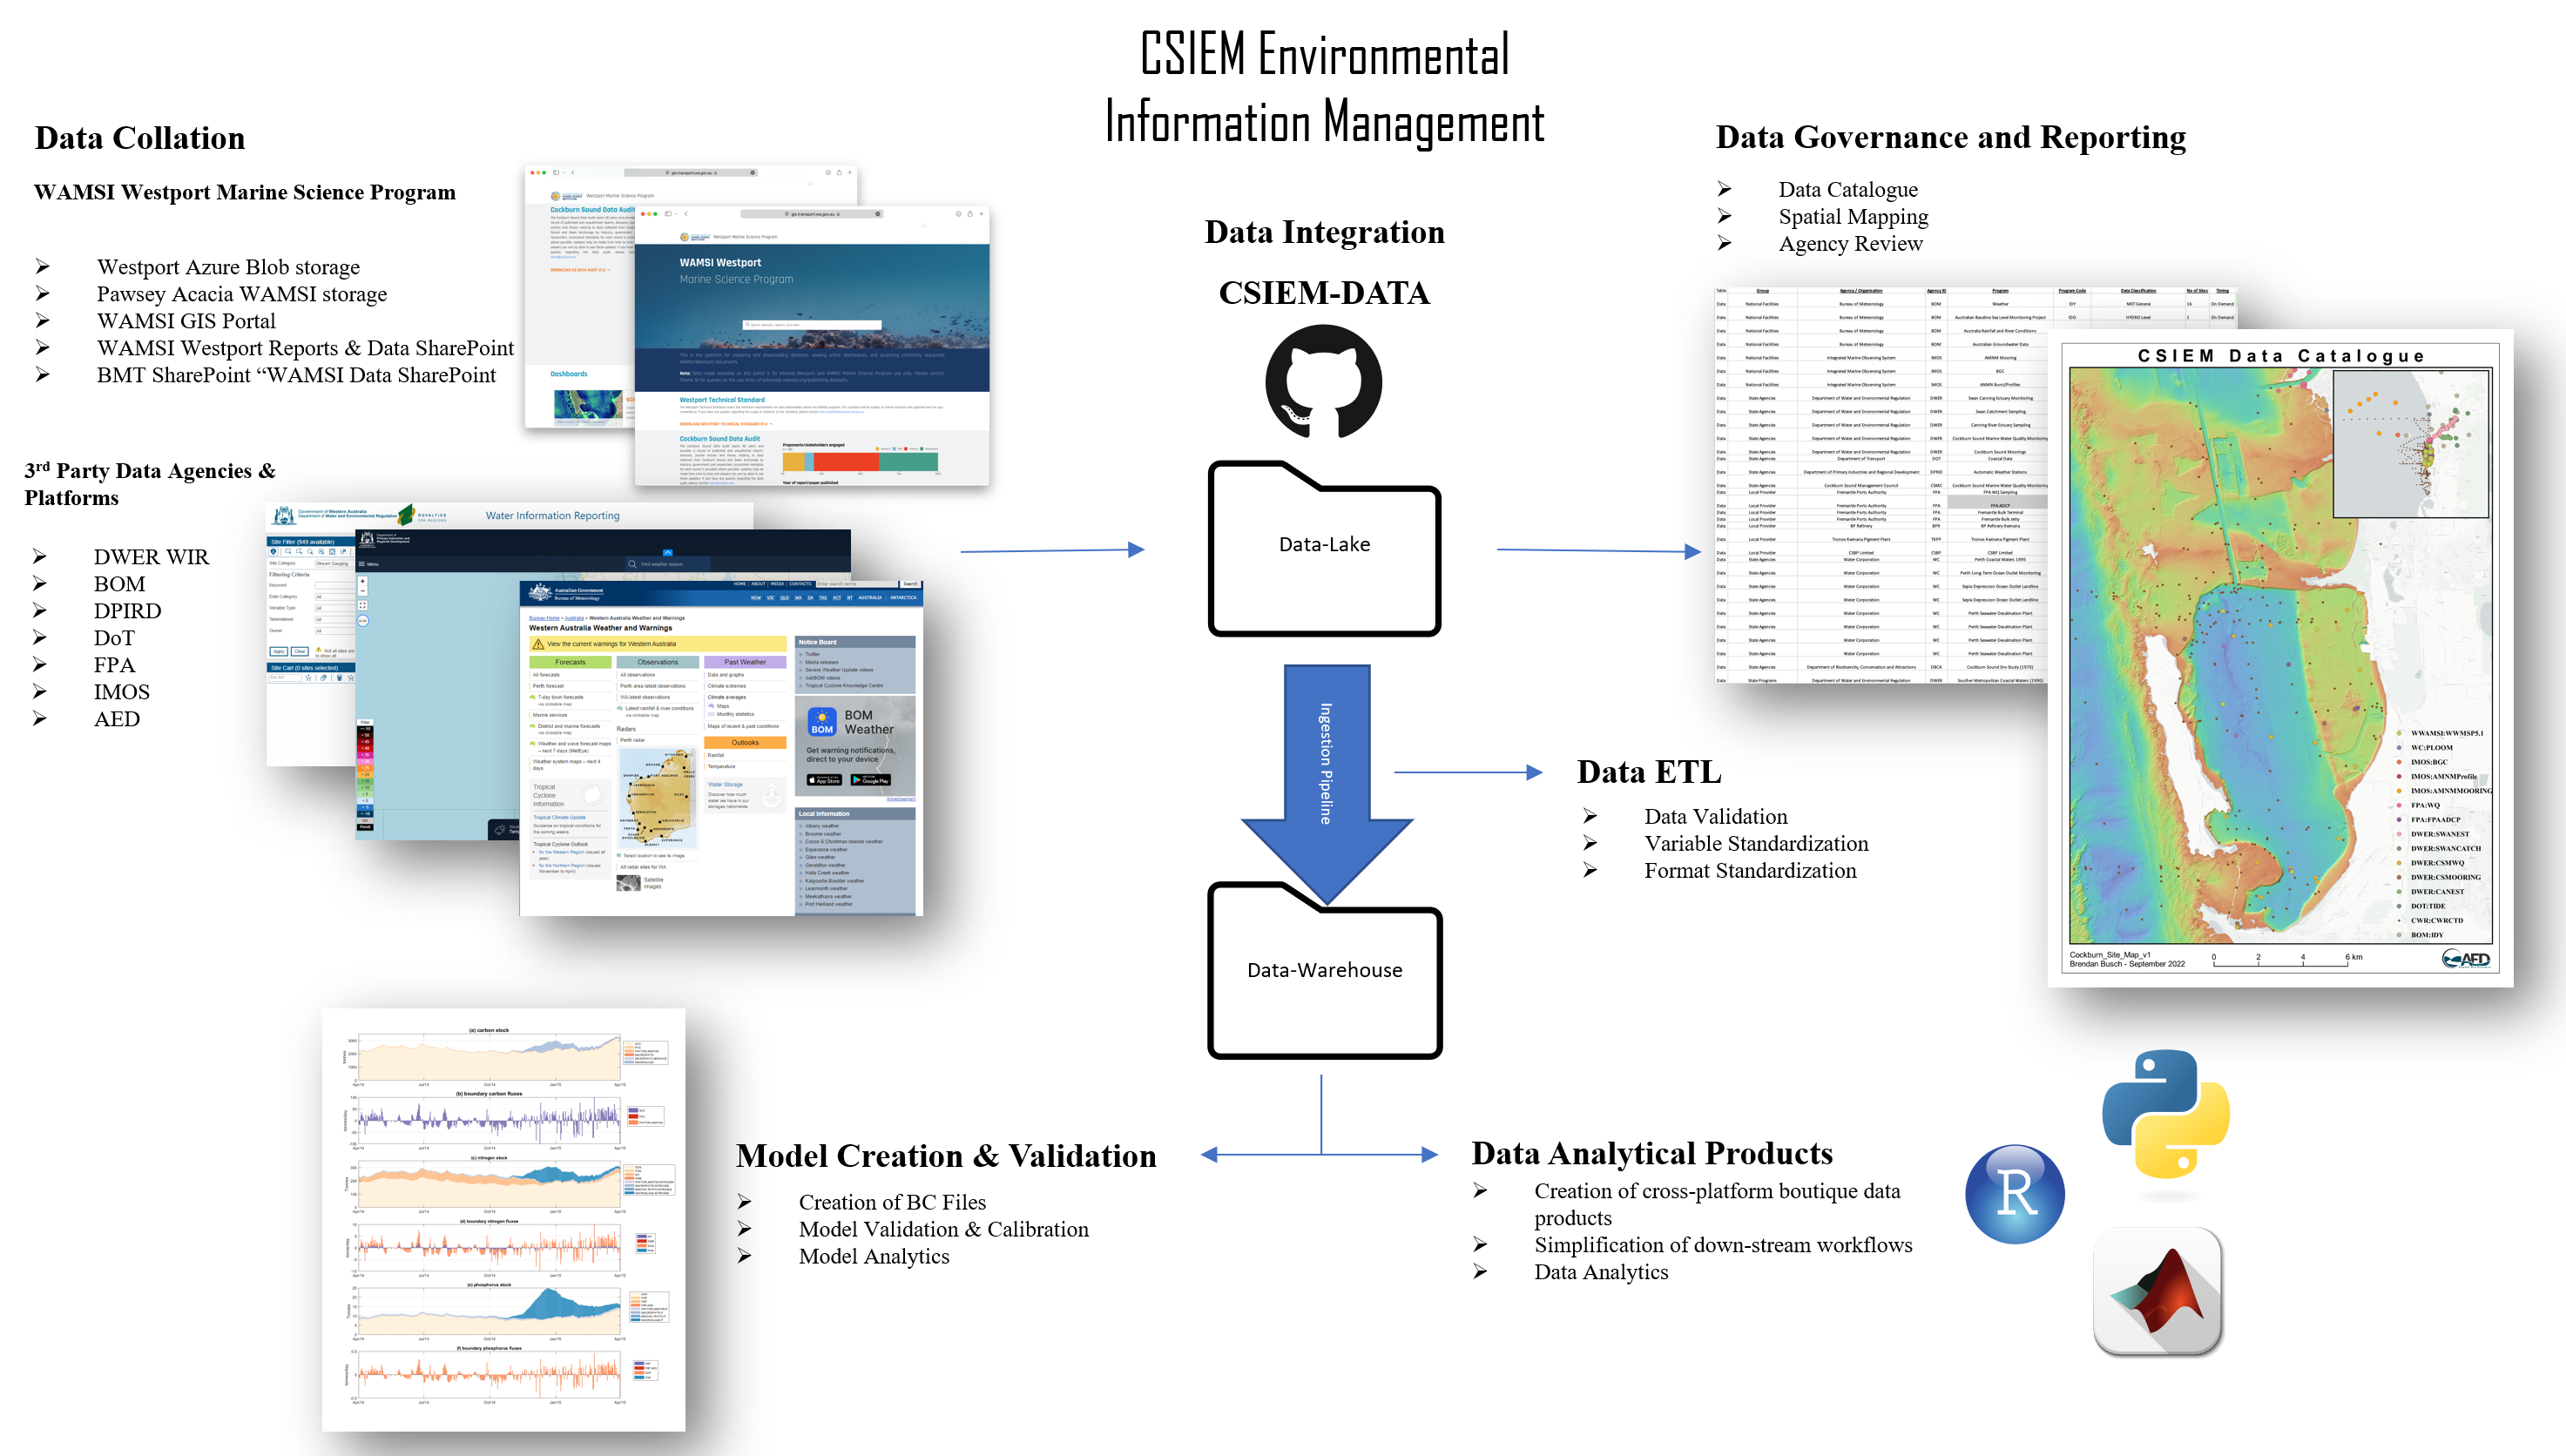
Figure 3.5: CSIEM Environmental Information Management overview (click to enlarge).
3.3.1 Data Collation
The aim of the data collation step is to bring data together in a co-ordinated way. Data that is sourced and collated from various government agencies, researchers and industry groups is stored in a “data lake” (see Section 3.3.3) in their raw format. Each data provider is assigned a unique agency identifier, and datasets are also grouped based on the main programs or iniatives the collection was associated with. Raw data is stored in a rigid folder structure based on these two identifiers : Agency/Program/ < ... data-sets ...>
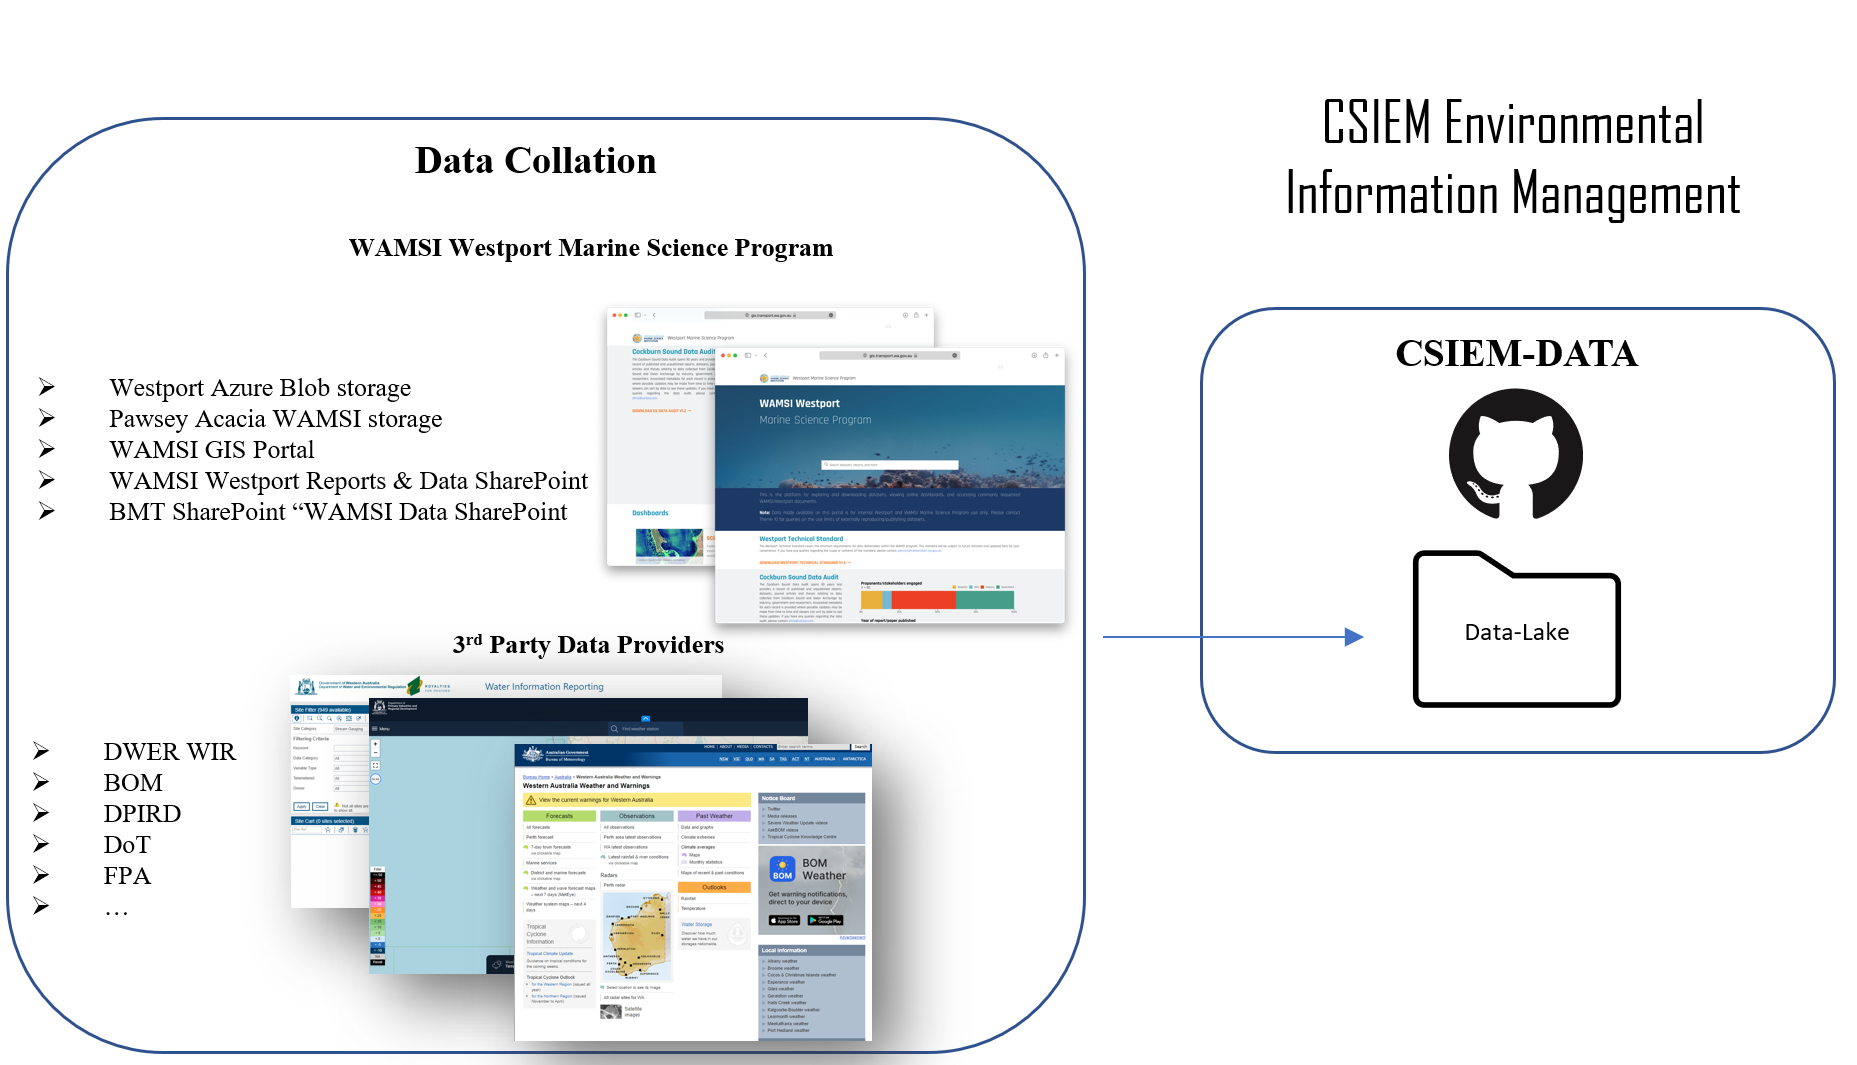
Figure 3.6: Data flow into the date lake. Raw data is allocated to folders based on the agency and program of orgin, and version controlled within the csiem-data GitHub repository (right box).
Data stored within the data lake is not formatted or processed in any way. Removal of duplicated and depreciated datasets is handled by the ETL (“Extract, Transform, Load”) pipelines outlined in Section 3.3.3. As such, strict data governance is required to maintain control and understanding of the contents of the data lake.
3.3.2 Data Governance
Data Governance is the process of managing the availablity and usablity of data within the CSIEM Environmental Information Management system. Governance can be loosely broken up into four key areas:
- Classification
- Cataloguing
- Mapping
- Versioning
Each step has been designed to allow the users of the system to quickly understand the avalaiable data contained within the lake, the spatio-temporal extent that each data-set covers, as well as identify areas of missing or unavailable data (Figure 3.7). The final step is a version controlled repository of the data, stored within the data-lake folder of the csiem-data GitHub repository.
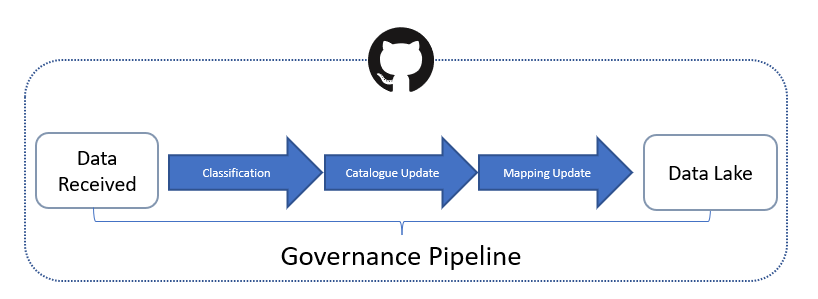
Figure 3.7: Steps for governance of new and updated data-sets.
3.3.2.1 Data-set classification
Each data-set that is added to the data lake is classified with a standard set of attributes (see Section 3.3.2.2), the three most important being:
- Agency
- Program
- Data Type
In order to maintain the usability of the data lake, given it’s unstructured nature, it’s important to ensure consistancy when deciding where a particular data-set is to be stored. In the domain of the CSIEM Environmental Information Management system, all raw data is stored in the strict folder stucture agencycode/programcode. If a particular agency program is unknown, a program code must be assigned during the cataloguing proceedure. Multiple data-sets collected as part of a program can be organised freely.
Each dataset is also given a specific data category to facilitate user searches and downstream conversions and integration with the modelling tasks (see CHapter 4). Data is categorised in the general areas of :
- Bathymetry
- Meteorology
- Hydrology
- Water Quality
- Sediment
- Biota
- Knowledge
- Operational
These are defined into sub-categories, as outlined in Table 3.1.
| Classification | Description |
|---|---|
| MET General | General weather data, including AT, RH, Wind, and/or Clouds |
| MET Wind | Wind data |
| MET Solar | Solar data |
| HYDRO Level | Water level data |
| HYDRO Flow | Water flow data |
| HYDRO Wave | Wave data |
| HYDRO Velocity | Velocity data, e.g. from ADV or ADCP |
| WQ Grab | WQ sample taken for laboratory analysis, e.g., nutrients |
| WQ Sensor | WQ sensor deployed at a fixed position |
| WQ Profile | WQ profiles |
| WQ Image | WQ image from satellite or remote vehicle |
| SED Grab | Data taken from a sediment core or grab |
| SED Flux | Sediment flux data, from core or bethic chamber |
| SED Profile | Sediment profile data (e.g., porewater) |
| ECO Benthic | Benthic biomass or species abundance, incl life cycle data, e.g., seagrass biomass |
| ECO Pelagic | Pelagic biomass or species abundance, incl life cycle data, e.g., phytoplankton |
| ECO Flux | Biological flux such as in situ uptake rate, e.g. photosynthesis, respiration |
| MIXED | Data is a mixture of above categories |
| UNCLASSIFIED | Data yet to be classififed |
| BATHYMETRY | Bathymetric data |
3.3.2.2 Cataloguing
All data entering the sytem is recording in the csiem_data_catalogue.xlsx spreadsheet that can be found the data-lake directory in the cseim-data GitHub repository. A full outline of the latest CSIEM data catalogue is included in Appendix A: Data Catalogue. A summary overview diagram is shown below in 3.8 .
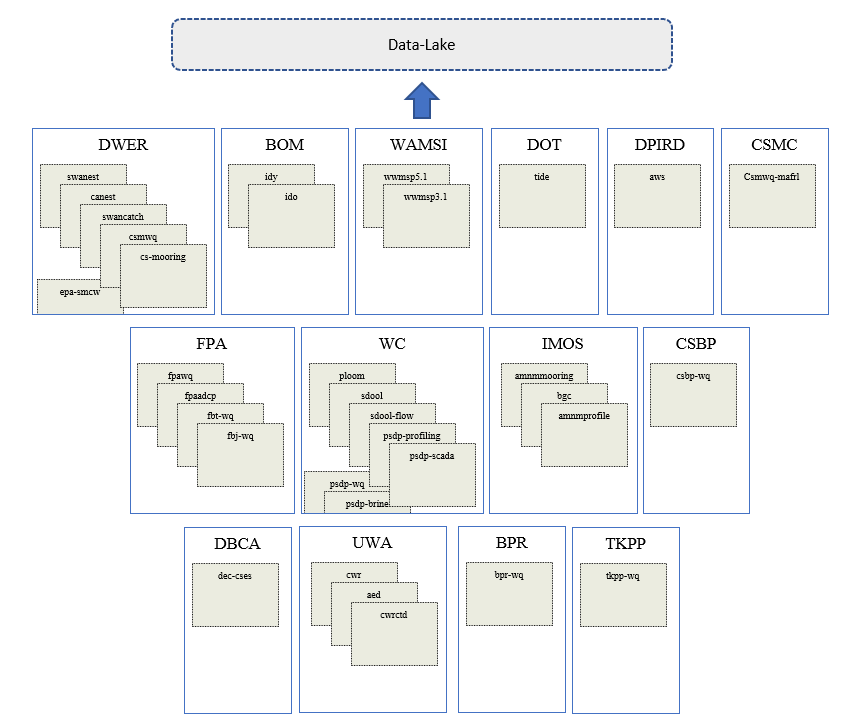
Figure 3.8: Data catalogue overview showing data sources organised by agency and programs (under development; click to enlarge).
3.3.2.3 Station/Site mapping
Independant GIS files are produced for each dataset added to the data lake. Not only does this allow for ease of mapping and visualisation, it serves as an important cross check of the ingestion pipelines and any co-ordinate system conversions that have occurred within the pipeline.
Each dataset has a corresponding csv file saved within the data-mapping directory of the csiem-data, with the file name corresponding the the agencycode/programcode outlined above.
| Agency | Agency ID | Program | Program Code | Data Classification | Station ID | Station Name | Lat | Lon |
|---|---|---|---|---|---|---|---|---|
| Department of Transport | DOT | Coastal Data | TIDE | HYDRO Level | PTBAR02 | Barrack Street 02 | -31.95968 | 115.8573 |
| Department of Transport | DOT | Coastal Data | TIDE | HYDRO Level | HLHIL01 | Hillarys | -31.82552 | 115.7386 |
| Department of Transport | DOT | Coastal Data | TIDE | HYDRO Level | RKMGL01 | Mangles Bay | -32.27443 | 115.7033 |
| Department of Transport | DOT | Coastal Data | TIDE | HYDRO Level | FFFBH01 | Fremantle Fishing Boat Harbour | -32.06554 | 115.7481 |
3.3.3 Data Integration
The CSIEM Environmental Information Management approach utilises a Data Lake –> Data Warehouse data management system, driven via custom batch “ETL” functions, triggered via GitHub actions or able to be run manually. This system has been implimented due to both the vast array of raw data inputs required for integarted modelling, as well as the diverse data analyical demands required across different agences and platforms.
3.3.3.1 GitHub
GitHub is a cloud based git repository service, with enterprise level version control and tracking. It has been chosen as the central repository for the data and the pipeline functions based upon it’s maturity as a platform, as well as it’s widespread adoption within industry and academia.
The csiem-data repository can be viewed and cloned here
3.3.3.2 Data Lake
A Data Lake is simply a centralised store of raw, disparate datasets, be it structured or unstructured. Centralising and cataloguing this raw data allows for customised ETL processes to be constructed that can be tailored to each analytics usecase, as opposed to forcing the data into a one size fits all structure.
However, because the data is primarily being stored in it’s raw format, goverance beomes extremely important so that data assests are not lost in the lake.
3.3.3.3 Data Warehouse
The Data Warehouse is the store of boutique, costomised data products produced through the batch ETL (Extract, Transform and Load) pipelines. Each folder within the data-warehouse directory on GitHub contains processed data in different formats, based upon end user requirements.
All data usage outside of the ETL pipelines should and must be carried out from products within the warehouse. This will ensure both the efficient and repeatability of any script or data product produced downstream, as well as providing a constant data pathway for data validation.
3.3.3.4 Data Pipelines & ETL
Each dataset found within the data-lake is extracted via the ETL pipeline ustilising code found in the code\import directory. As each dataset is stored in it’s raw form, extraction and transformation is more often than not going to require a unique codebase. As such, a unified pipeline is not being developed at this stage, and each data source will have it’s own codebase. To facilitate this, each code base will draw upon share glossaries (such as the variable glossay discussed below) and conversion tables, to ensure standardisation.
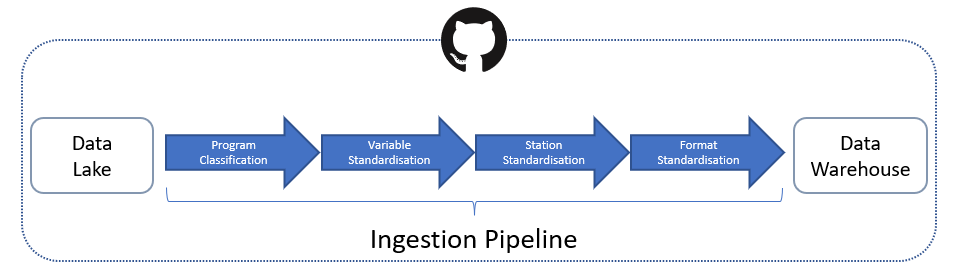
Figure 3.9: ETL (Extract, Transform, Load) data workflow diagram.
3.3.3.5 GitHub Actions
One of the primary reason for choosing GitHub to house the CSIEM Environmental Information Management system is GitHub Actions. GitHub actions allows for the automation of workflows, using a variety of languages and technologies. Pipelines constructed in both Pyhton and Matlab can be automated and run in parrallel via simple configurations. Pipelines can be constructed that can be automated and processed on a wide variety of platforms and operating systems.
3.3.3.6 Variable Standardisation
Fundamental to the data collation program is the concept of data standardisation. All data contained within the data lake is processed nightly into standardised data products.
As part of this standardisation, all incoming variables need to be converted into a common variable name and unit. To facilitate this, a global variable translation glossary is being developed, which will allow the data engineers to quickly and transparently create importation scripts to process new datasets.
Master variables are first defined, with a unique identifier, variable name, units and symbol (if applicable) Table 3.3.
| Variable ID | Variable Name | Units | Symbol | Programmatic | CF Name | CF Units | CF Conversion |
|---|---|---|---|---|---|---|---|
| var00006 | Salinity | psu | S | salinity | sea_water_salinity | g kg-1 | 1.00 |
| var00007 | Temperature | ^{}C | T | temperature | sea_water_temperature | K | -273.15 |
| var00013 | Turbidity | NTU | C_T | turbidity | sea_water_turbidity | NTU | 1.00 |
| var00129 | Wind Direction | ø | NA | wind_direction | wind_to_direction | degree | 1.00 |
| var00130 | Wind Speed | m/s | NA | wind_speed | wind_speed | m s-1 | 1.00 |
| var00140 | Secchi depth | m | NA | secchi_depth | secchi_depth_of_sea_water | m | 1.00 |
| var00153 | Air Temperature | ^{}C | NA | air_temperature | air_temperature | K | -273.15 |
| var00154 | Wet Bulb Air Temperature | ^{}C | NA | wet_bulb_air_temperature | wet_bulb_temperature | K | -273.15 |
| var00155 | Dew Point Temperature | ^{}C | NA | dew_point_temperature | dew_point_temperature | K | -273.15 |
| var00156 | Relative Humidity | % | NA | relative_humidity | relative_humidity | 1 | 100.00 |
| var00157 | Max Wind Speed | m/s | NA | max_wind_speed | wind_speed_of_gust | m s-1 | 1.00 |
| var00177 | Station level pressure | hPa | NA | station_level_pressure | air_pressure | Pa | 0.01 |
Once a new data source has been added to the data lake, a custom key is defined for the new variables and unit conversions created to standardise the dataset to the ingestion data standard (see Chapter 4) 3.4.
| Header | Conv | Key | Key Value |
|---|---|---|---|
| Alkalinity (tot) (CaCO3) (ug/L) | 1.000 | var00139 | Total Alkalinity |
| Bottom Depth (m) | -1.000 | var00179 | Bottom Depth |
| C (sol org) {DOC, DOC as NPOC} (ug/L) | 1.000 | var00029 | Dissolved Organic Carbon |
| Chlorophyll a (by vol) (mg/L) | 1.000 | var00014 | Chlorophyll-a |
| Chlorophyll b (by vol) (mg/L) | 1.000 | var00131 | Chlorophyll-b |
| Chlorophyll c (by vol) (mg/L) | 1.000 | var00132 | Chlorophyll-c |
| Chlorophyll sample volume (mL) | 1.000 | var00178 | Chlorophyll sample volume |
| Cloud cover (%) | 1.000 | var00133 | Cloud Cover |
| Cond @ 25 deg C (uS/cm) | 1.000 | var00134 | Conductivity |
| Flow status (no units) | 1.000 | var00135 | Flow Status |
| N (sum sol org) {DON} (ug/L) | 0.001 | var00032 | Dissolved Organic Nitrogen |
| N (sum sol ox) {NOx-N, TON} (ug/L) | 0.001 | var00026 | Nitrate |
3.4 Model-derived Data Governance
Model derived data is used extensively throughout the research program, from providing direct input into other models (nesting) through to model validation. As such, model governance plays an equally import role as data governance. It is treated separately as model data is not stored directly in a single lake environment, but accessed and processed in a variety of ways depending on it’s size and storage location.
The Pawsey Acacia Storage is the primary home for model data produced by the different project teams. This storage space represents the long-term point of truth storage for these products. However, thrid-party produced models, as well as curated secondarily produced products derived from primary models will also be stored temporarily on Acicia for the duration of the project. Model data such as BOM’s BARRA-R output that is used directly as an input into a model, or used as a vailable source for other data will be downloaded and stored, with any workflow’s produced directly referencing that Pawsey stored data.
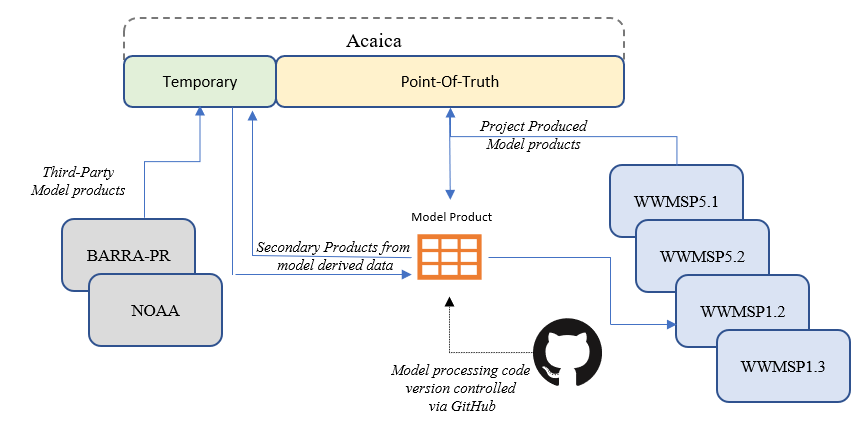
Figure 3.10: Model governance and storage.
3.5 Adding New Data Sources
The data repository is a constantly evolving collection that can be automatically updated for existing data sources, or new data sources can be added at any time. In order to maintain the constancy and quality of the data products stored in the data warehouse, it’s important to follow the below outlines steps when adding new data sources. These steps are:
- Add raw data to the data-lake directory, filing it under agency and project subdirectories.
- Update the CSIEM_Data_Catalogue.xlsx found in the data-governance directory
- Check & update the variable_key.xlsx spreadsheet with any new variables
- Add a new conversion tab in the variable_key.xlsx spreadsheet for the variable conversions required for the new data
- Add new sites to the site_key.xlsx
- Create a new import ETL script in the code/import directory to import the new data into the warehouse base format (csv).
- If the data extraction is to be updated daily, add new lines into the code/actions scripts to trigger your import function.
- Add a new site to the obs_maps.csv to the csiem-science/maps/csiem_data/Obs directory in the csiem-science GitHub repository.