4 Model-Data Organisation
The data requirements for the modelling are diverse and varied, spanning hydrological, meteorological, water and sediment quality (long-term monitoring, data from intensive campaigns and in situ sondes), plus ecological survey data. This creates an integration challenge for model setup, parameterisation and assessment (calibration and validation) (Figure 4.1).
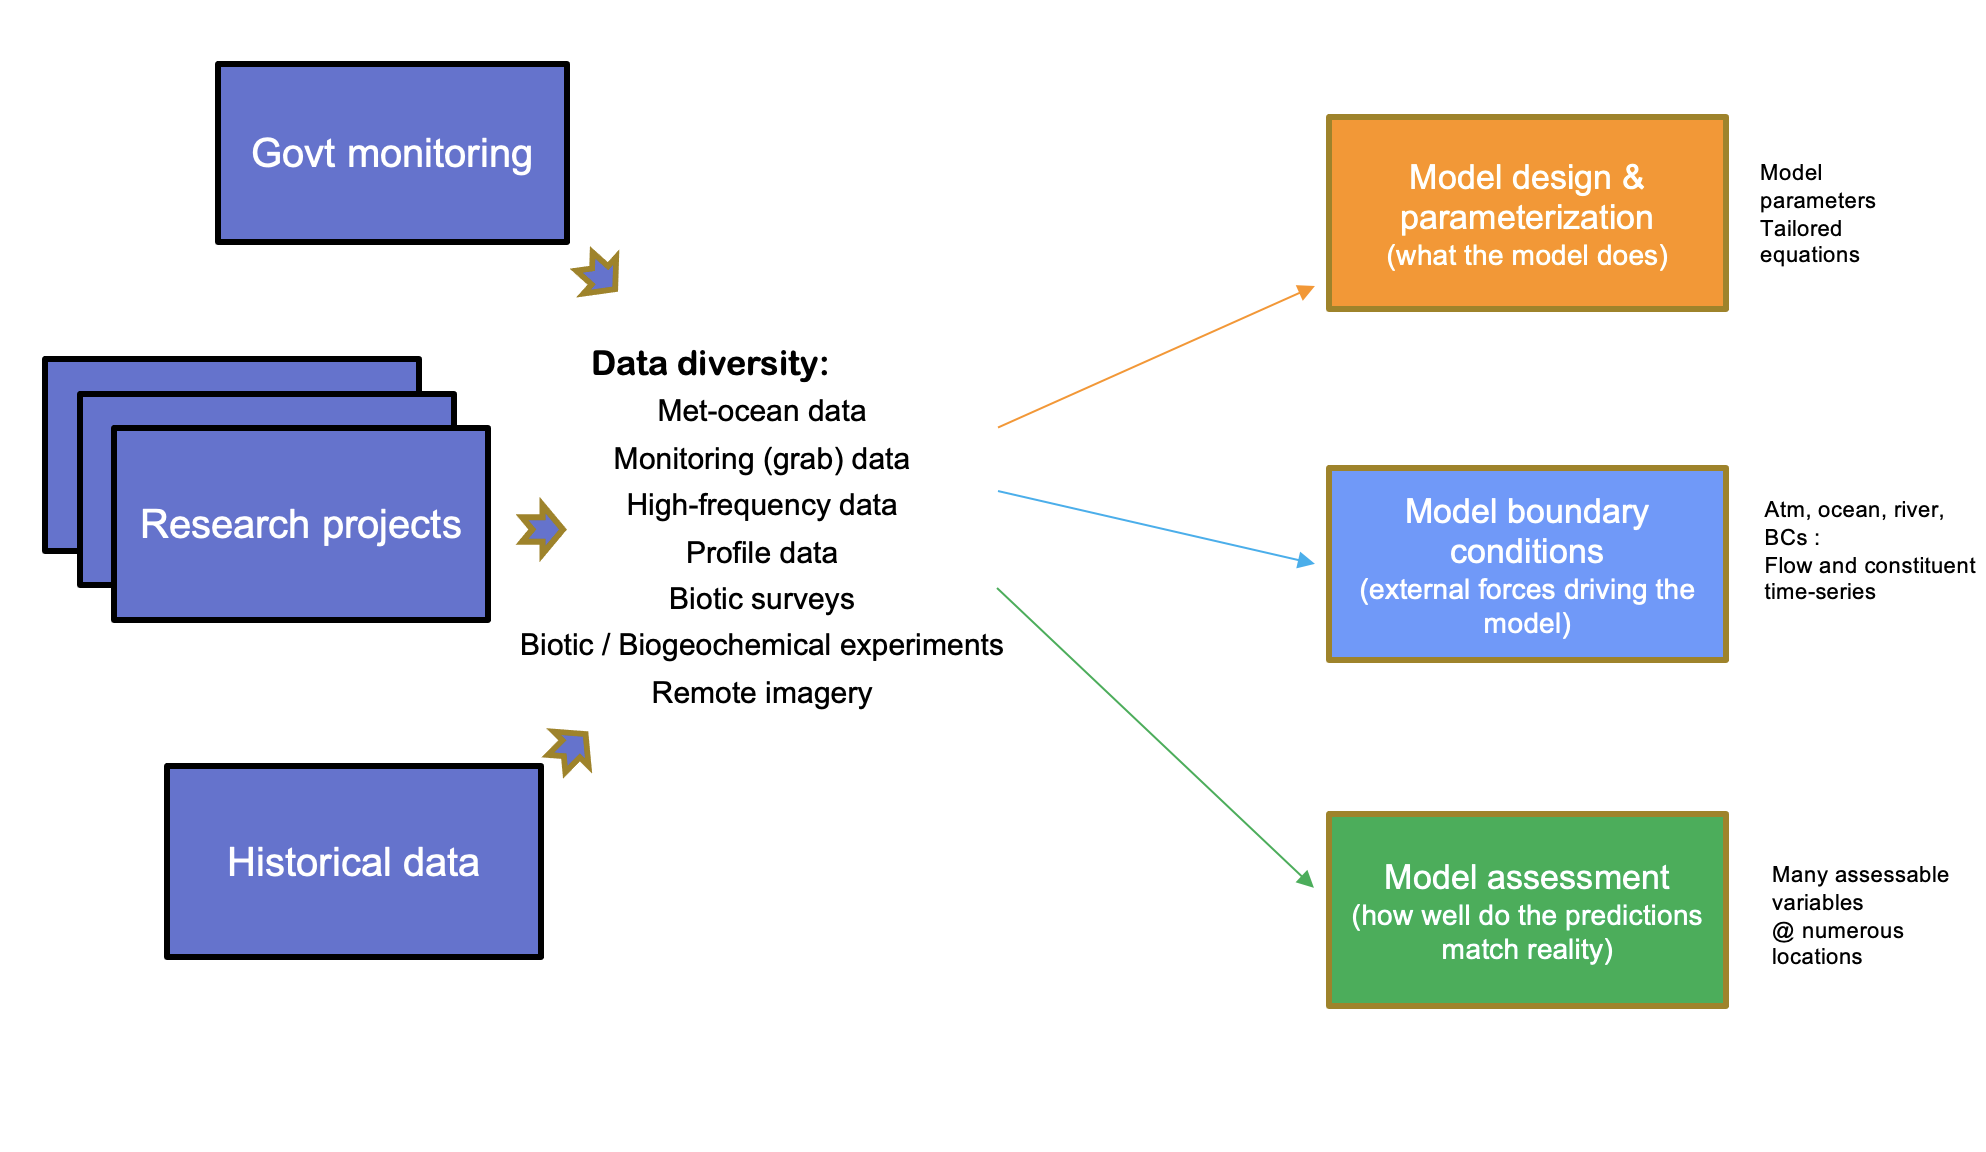
Figure 4.1: The model-data ecosystem and conceptual approach to model-data integration, accomodating data diversity and varied model requirements.
As the model and data is always evolving we aim to support a process of Continuous Integration - Continuous Deployment (CI/CD), a set of software practices used to ensure practicies to deliver code (model files and data products) changes frequently and safely. To enable the ongoing use and development of the CSIEM in this context, we have developed a model-data integration framework able to be used by stakeholders to co-ordinate the reference datasets needed for model development, and standardise the data integration and modelling workflows. The below sections describe how the CSIEM is organised, the tools and approaches used for model provenance and managing data streams, and model versioning.
4.1 CSIEM repository structure and organisation
The CSIEM repository ecosystem has been designed is such a way to both facilitate the sharing of data and models across various agencies and researchers, as well as providing a formalised structure to store, catalogue and process complex and unique datasets. Comparmentalised data structures have been implemented to allow for tracking and version control of data and models as they are utilised and upgraded throughout the project. Given the complexitites and scope of the requirements, four interconnected repositories have been created to house and share the accumulated project outputs:
- csiem-science: a repository for documenting the CSIEM workflows, model-data structure and integration, and results (the current CSIEM bookdown online manual);
- csiem-data: a platform for storing and sharing environmental data for this project (see Chapter 3);
- csiem-model: a platform for storing and sharing model files and configurations;
- csiem-marvl: a collection of scripts for visualising, assessing and reporting the data and model performance.
Github has been chosen to house the repository based on it’s mature version control systems and cross platform program support to aid all stakeholders accessing the data and models (https://github.com/). In addition, there is a wide variety of documentation online to assist users new to GitHub. Information on how to clone a publicly available GitHub repository can be found here.
Data cataloguing via the “CSIEM Data Catalogue” (described in Section 3.3) has been designed with cross-agency usage in mind. Integration with the WAMSI Theme 10 Data Catalogue is essential to allow for the tracking of data changes and upgrades throughout the project, and to be used for modelling purposes. The “Point of Truth”, “WAMSI Catalogue Classification” and “Status Notes” categories have been included in the CSIEM Data Catalogue to track a dataset’s evolution throughout the project.
4.1.1 Online repository access
The data and model files are stored in the Github CSIEM Repository and shared with WAMSI research partners and end-users.
4.1.2 High level model-data integration workflows
The raw data collected from previous works and current WAMSI research project outcomes are stored in the csiem-data folder and classified by their sources. These raw data are then post-processed using standard scripts to convert the raw data into ‘standardised’ data formatd (stored in the data-warehouse folder) that can be used for model configuration and boundary/initial conditions (stored in the csiem-model folder), and for model/data visualization, model calibration/validation, and reporting using the csiem-marvl analysis library. The data-model workflow is shown in Figure 4.2.
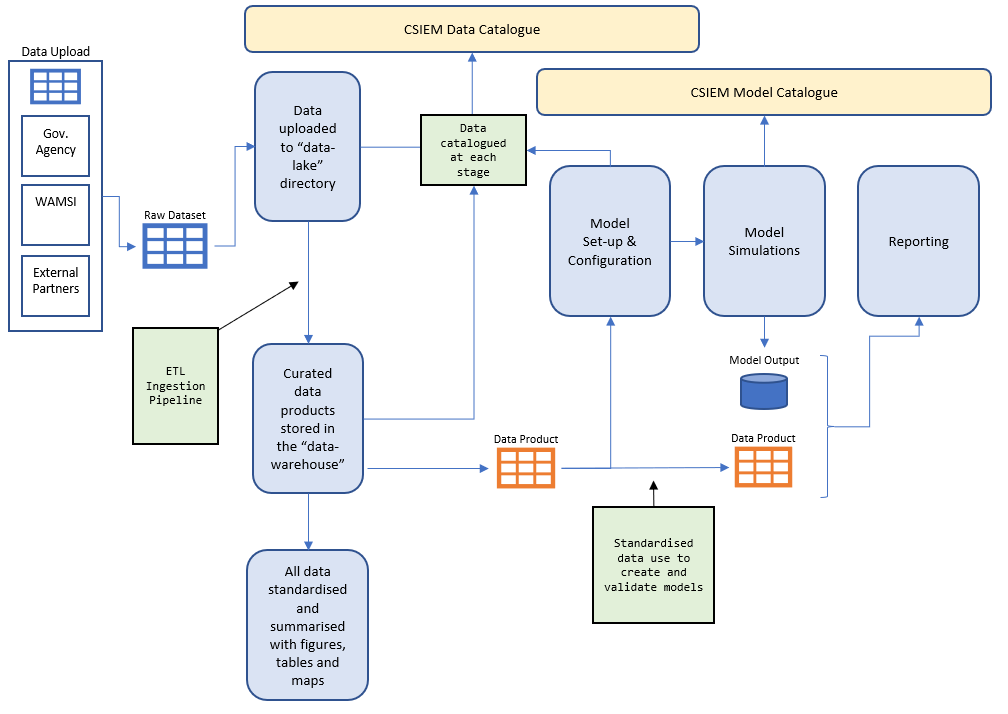
Figure 4.2: CSIEM conceptual diagram showing the flow of data through the system
4.2 Data repository and management
The details of data collection, processing, and catagorizing have been described in Chapter 3.3 and Appendix A. This section introduces the data repository and management related to the data-model integration framework.
4.2.1 Data repository folder structure
The data repository folder structure follows the logic of data types and resources as shown in Figure 4.3.
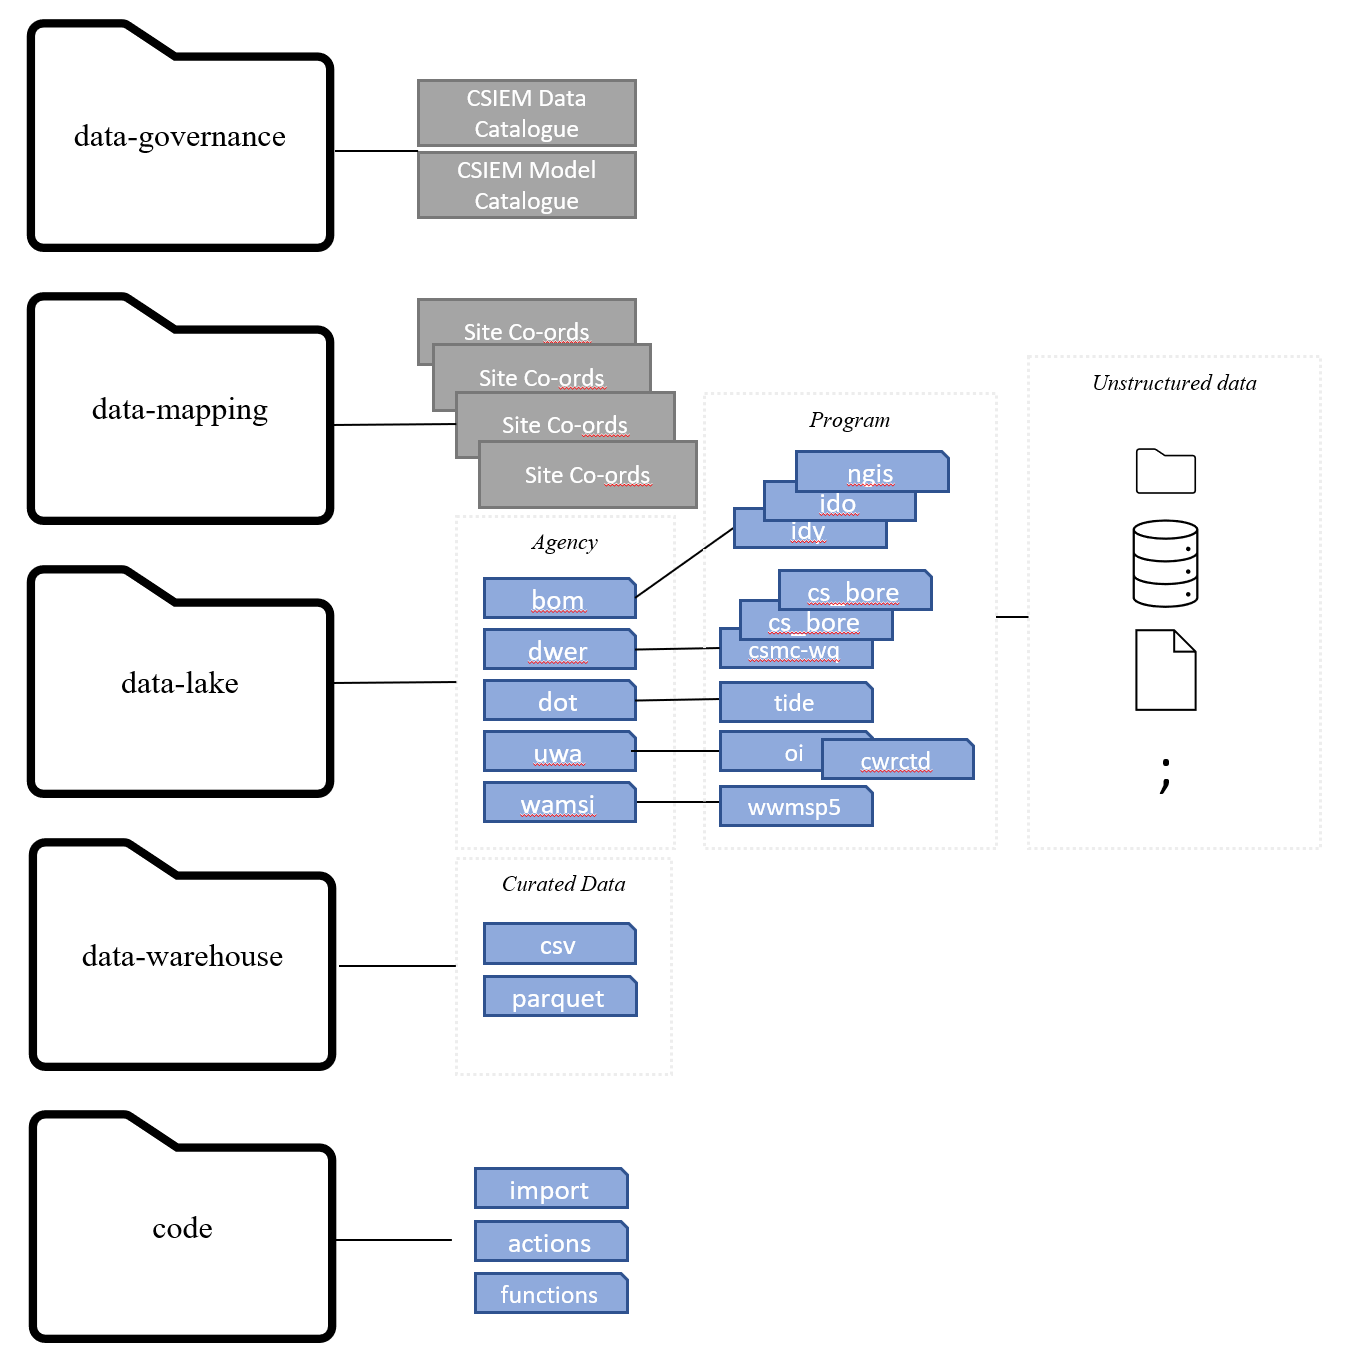
Figure 4.3: CSIEM Data online storage folder structure
The root directories are listed and described below:
| Folder Name | Description |
|---|---|
| data-governance | Document repository for data governance |
| data-lake | Storage of raw, unstructured data |
| data-mapping | GIS mapping information pertaining to the files stored in the data-lake directory |
| data-warehouse | Storage for curated datasets. |
| code | Storage for importation pipeline code as well as secondary data products |
4.2.2 Data catalogue
All data that is uploaded to the CSIEM github repository is logged in the csiem-data CSIEM Data Catalogue. The catalogue (found in the data-governance directory) is comprised of a main data sheet (“CSIEM Data Catalogue”) as well as summary sheets for all processed data. Every raw datafile is logged with the following information:
| Classification | Description |
|---|---|
| Group | Desciptor for the data Agency / Group |
| Agency / Organisation | Agency name |
| Agency ID | Unique Agency Code |
| Program | Program Name |
| Program Code | Unique Program Code |
| Data Classification | Data Classification |
| No of Sites | Number of data sites |
| Timing | Date Extent of the data |
| Mapping / Sites | Y/N flag if mapping files have been created: data-mapping |
A catalogue of all relevant data under management is provided in Appendix A.
4.2.3 ETL (Extract, Transform and Load) workflows
All of the ETL pipeline scripts for the CSIEM Environmental Information Management are all contained within the code/ directory, which has three subfolders:
-
import: All scripts that process the raw data from the data-lake into the data-warehouse. -
actions: GitHub action functions, and well as secondary functions to control with pipeline is executed automatically. -
functions: Shared function that scripts within the above directories may call.
Scripting has been predominately carried out utilising the Matlab programming language, however there are scripts within the scripts directory using both R and Python. Users are able to add scripts in their preferred language; the repository core scripts for data storage and model plotting are currently in Matlab.
Below is an example workflow outlining how a meteorological boundary condition file for the TUFLOW-FV model is created (Figure 4.4. Data is first downloaded and processed by scripts in the code directory. Standardised data is then stored in the data-warehouse for usage in the creation of model boundary input file and in the MARVL visualisation and analytics package.
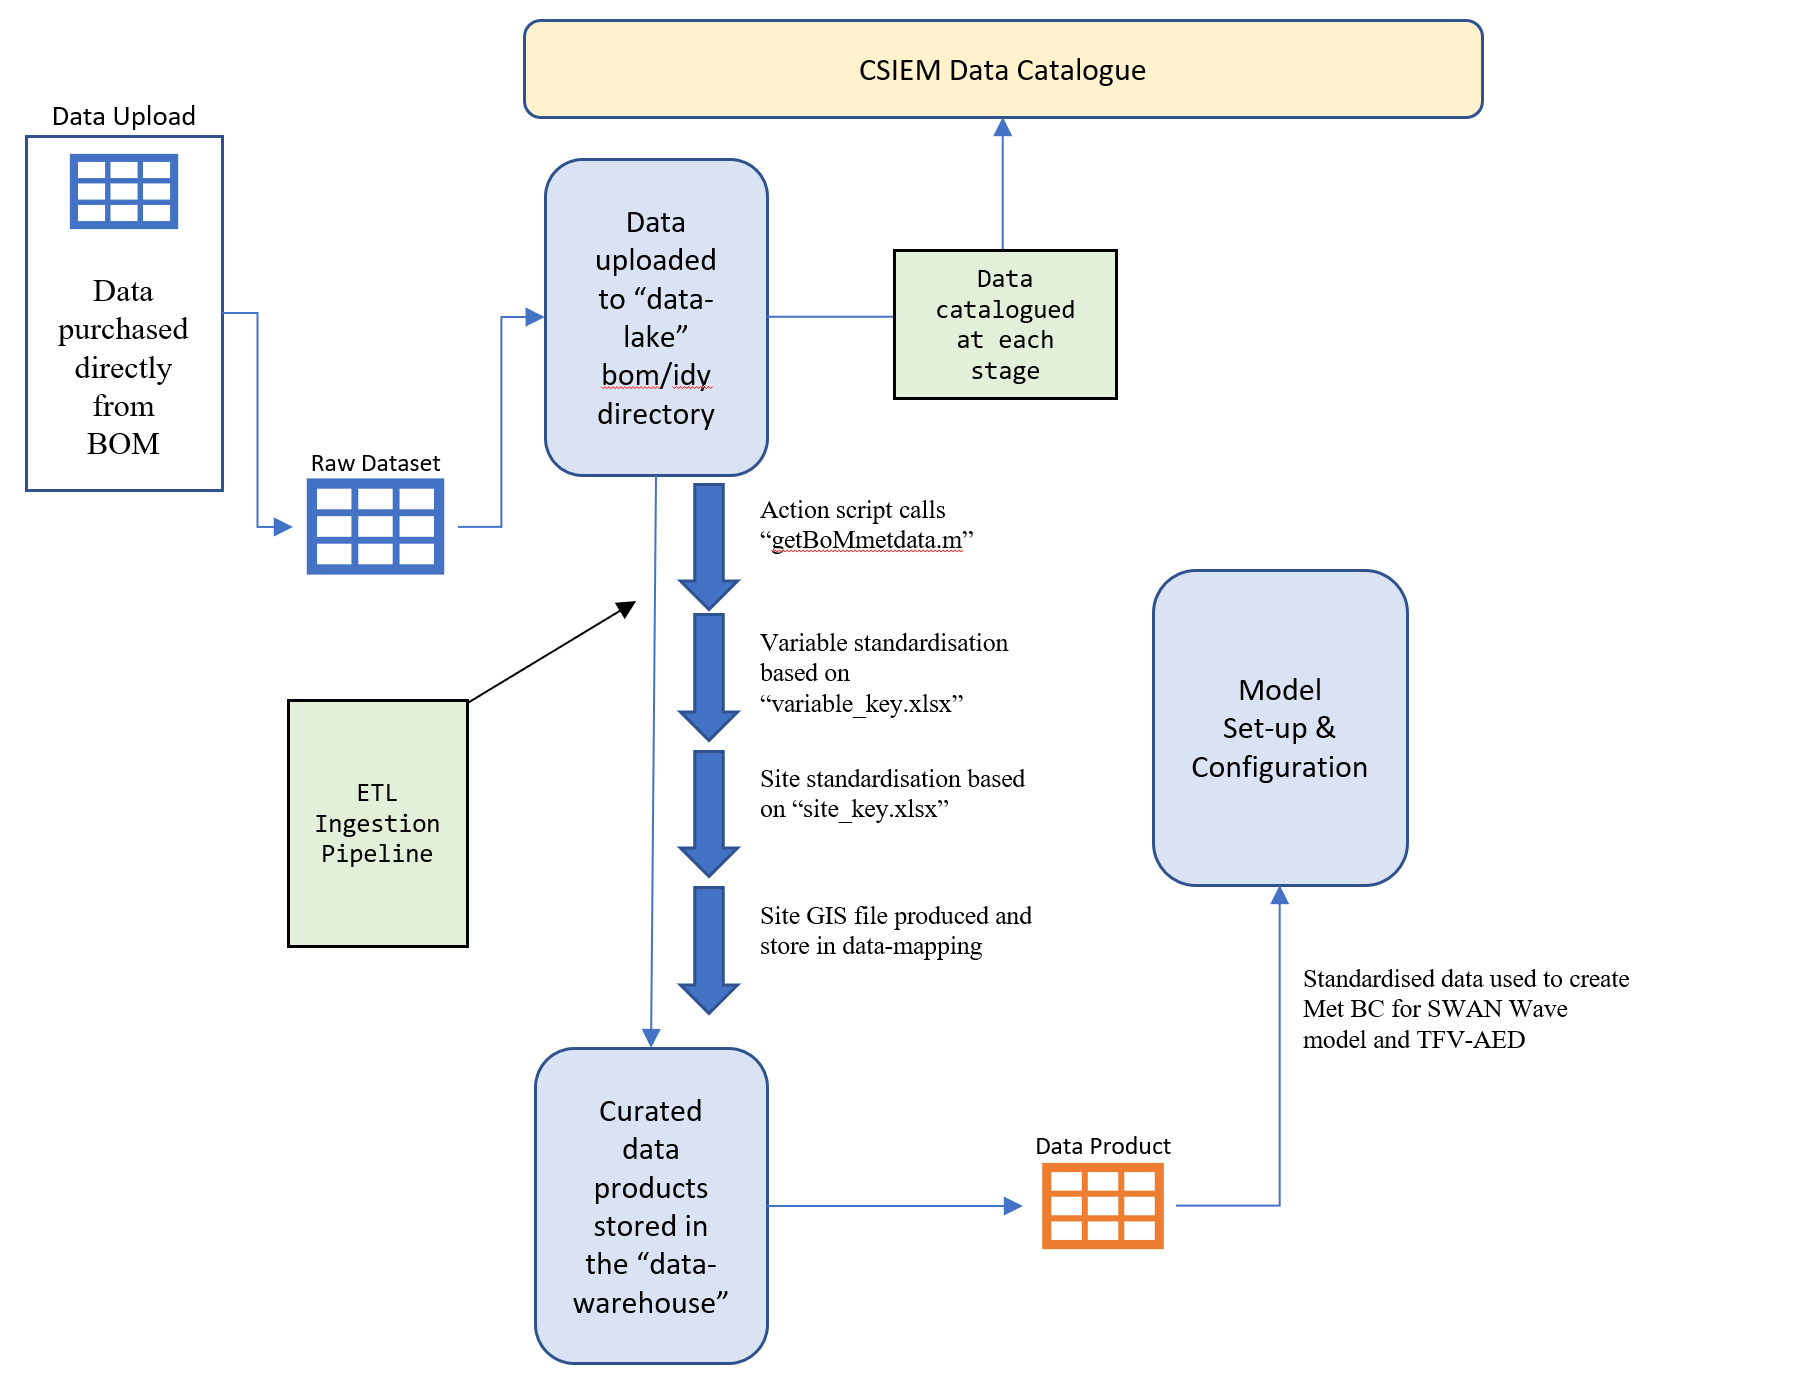
Figure 4.4: CSIEM work flow diagram for met data
4.3 Model repository and management
4.3.1 Simulation naming and organization
All model files that are developed within the WAMSI Westport Research program are stored in the csiem-model repository, and the model files are classified with project names and model generation identifiers as the model is developed over time. The naming of model folders follows the convention of {Agency Code}_{Program Code}_{Model Code}_{Model Version}_{Model Period}, where the ‘Agency Code’ includes the organizations of:
-
WaterCorp: model files used for assessing PSDP by the Water Corporation; -
Westport: model files developed for assessing Westport Phase 1 scenarios; and -
WAMSI: the core CSIEM model files being updated throughout the WAMSI Westport integration project.
The other identifier fields are optional and will be included whereas available. ‘Program Code’ indicates which research program the model was deveoped for; ‘Model Code’ indicate which model was being used, ‘Model Version’ indicates the version through model development, and ‘Model Period’ indicates the time of simulations. For example, the model folder WAMSI_wwmsp_tfvaed_gen0_2021_2022 contains the preliminary version of model files developed for WAMSI WWMSP program using the TUFLOW-fv-AED model, focusing on the time 2021-2022.
As an example, the following models are existing or under development and operational within the csiem-model repository:
-
WaterCorp_psdp2_tfvaed: previous BMT model files for assessing Perth Seawater Desalination Plant 2, for multiple periods; -
WestPort_breakwater_swan_2011_2020: BMT SWAN wave simulation for WestPort; -
WAMSI_wwmsp_wwm_gen1_2011_2021: WAMSI PROJECT 5.2 wave simulation for Cockburn Sound; -
WAMSI_wwmsp_tfvaed_gen0_2021_2022: preliminary version of model files developed for WAMSI WWMSP program using the TUFLOW-fv-AED model, focusing on the time 2021-2022; -
WAMSI_wwmsp_tfvaed_gen1_2021_2022: BMT Cycle 1 model files for WAMSI WWMSP program;
Each model folder may contain multiple simulation sets, but they will all rely on the same model base configuration, with minor differences or adujstments. Major changes to a model’s configuration will constitute a change in generation numeber and these are stored in a separate folder. Note, models uploaded to the CSIEM repository may have been created by different agencies and researchers and should maintain a consistent naming convention.
Beside the models developed within the WAMSI Westport Research program, there is also a range of environmental models, such as meteorology, wave, hydrodyamics models, that can be used as boundary conditions or reference simulations for Cockburn Sound. These environmental models are outlined in Table 4.3.
| Model | Model Description | Agency / Organisation | Agency ID | Program | Program Code | Start | End | Domain Extent | Storage Location | Status |
|---|---|---|---|---|---|---|---|---|---|---|
| Meteorology | ||||||||||
| WRF | South-western Australia Downscaled Weather Model | Murdoch University | MU | SW Climate | SWWA-WRF | 1970 | 2020 | SWWA | Pawsey | Completed |
| BARRA | BARRA Reanalysis | Bureau of Meteorology | BOM | BARRA-PR | BARRA-PR | 1990 | 2019 | Perth | NCI | Completed |
| Wave | ||||||||||
| SWAN | Cockburn Sound Breakwater Wave Model | BMT | BMT | Westport Breakwater Wave Assessment | W-BW | 2011 | 2021 | Cockburn Sound | BMT | Completed |
| WWM | Cockburn Sound Wave Model | Western Australian Marine Science Institution | WAMSI | WAMSI Westport Marine Science Program | WWMSP5.2 | 2011 | 2021 | Cockburn Sound | Pawsey | Ongoing |
| Hydrodynamics | ||||||||||
| ROMS | WA Regional Ocean Model | Western Australian Marine Science Institution | WAMSI | WAMSI Westport Marine Science Program | WWMSP5.1 | 2000 | 2022.5 | WA | Pawsey | Completed |
| TFV-AED | PSDP2 Environmental Assessment Model | BMT | BMT | PSDP2 | PSDP2 | 2005 | 2015 | Cockburn Sound | BMT | Completed |
| Hydrodynamics-Biogeochemistry | ||||||||||
| TFV-AED | Swan-Canning Esturaine Response Model | University of Western Australia | UWA | SCCM-SCERM | SCERM | 2007 | 2020 | Swan-Canning | UWA | Completed |
| TFV-AED | Cockburn Sound Integrated Ecosystem Model | Western Australian Marine Science Institution | WAMSI | WAMSI Westport Marine Science Program | WWMSP1.2 | 2010 | 2021 | Cockburn Sound | Pawsey | Ongoing |
| Ecology | ||||||||||
| EcoPath | Cockburn Sound Food Web Model | Western Australian Marine Science Institution | WAMSI | WAMSI Westport Marine Science Program | WWMSP1.3 | TBC | TBC | Cockburn Sound | Pawsey | Ongoing |
4.3.2 CSIEM TUFLOW-FV-AED model file organisation
The TUFLOW-FV-AED model is the main modelling platform of the WWMSP project and contains the following folder structure:
-
BCs: boundary condition files, including tide and inflow boundary files; meteorological boundary files, and initial condition files; -
External: AED model files linked with the TUFLOW-FV, and optionally the ‘GOTM’ vertical mixing model if the CSIEM is in 3D mode; -
Geo: TUFLOW-FV model structure files, including geometry and mesh files, and GIS files controlling the nodestrings and material zones; -
Input: model control/configuration files; -
Plotting: Directory to store model output images;
For WINDOWS users the model folder also contains a bin directory containing compatible binaries for the TFV-AED model
-
TFV:Build version: 2020.03.105 -
AED:Build version: 2.0.5b
4.4 Model Assessment, Reporting and Visualisation Toolbox Repository
The publicly available GitHub repository called csiem-marvl contains a wide variety of scripts and functions that are used to post-process and visualise model output. Scripts that have been specifically developed for this project are contained within the csiem-marvl repository. Plotting and model processing types include:
- Time-series plotting;
- Transect plotting;
- Model animation creation;
- Error assessment;
- Wave model plotting;
- Habitat mapping (e.g., Ruppia & Fish HSI processing and mapping)
- Scenario comparison and “DelMap” plotting;
- Nutrient budget assessments.
In particular, AEDmarvl_plot_timeseries and AEDmarvl_plot_transect are the main functions that are frequently used. The AEDmarvl_plot_timeseries function uses data and gis files stored in the csiem-marvl repository, in addition to model output to create timeseries plots of the model (averaged within a polygon region) compared against field data. The plotting function will also automatically calculate a range of error statistics based on model output and field measured data.
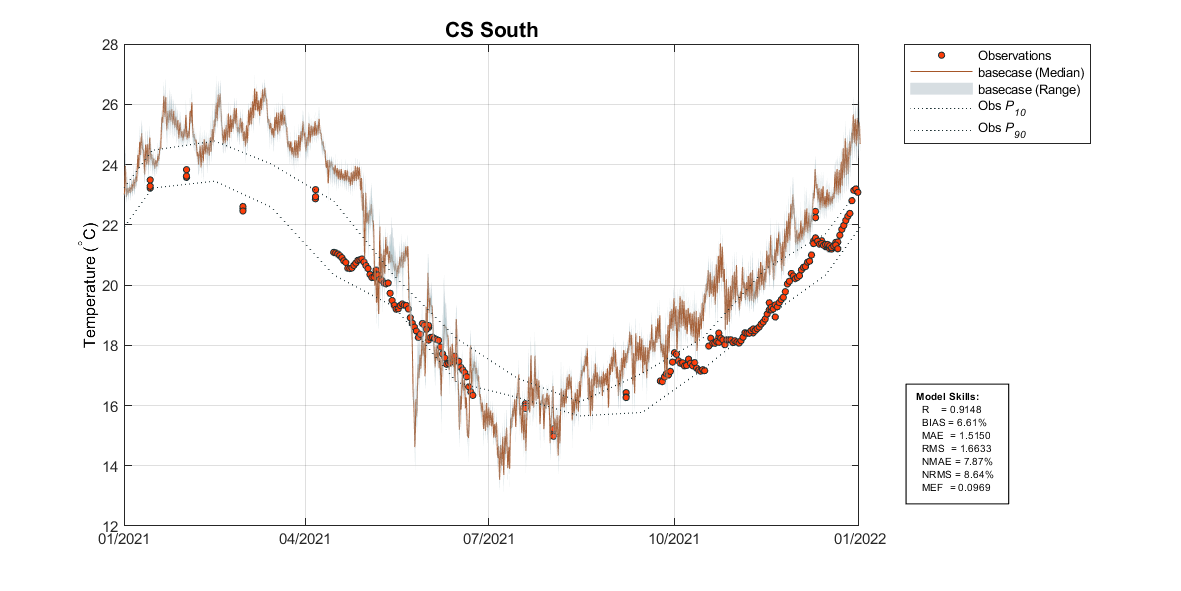
Figure 4.5: Example output from plottfv_polygon with error matrix
AEDmarvl_plot_transect can also be found in the csiem-marvl repository. This plots model data extracted along a transect line during a specified plotting period, and compares against the range of field data found within that period.
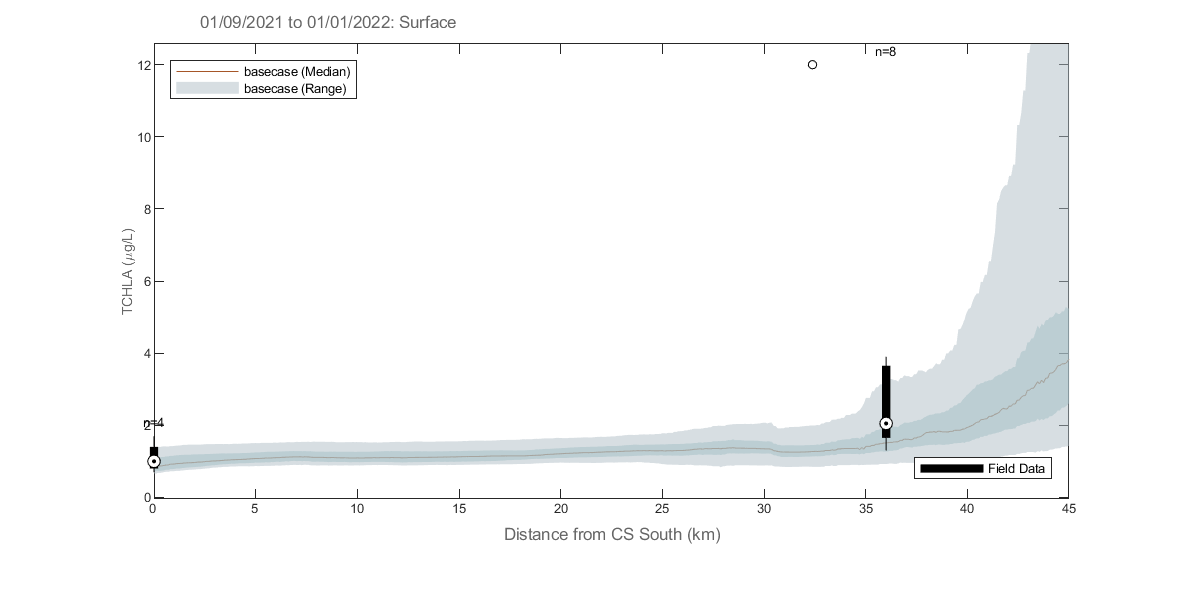
Figure 4.6: Example output from plottfv_transect with distance from Goolwa Barrage (km) along the x-axis
The csiem-marvl analysis library also houses scripts and functions for:
- Nutrient Budgeting;
- Stacked Area Transect;
- Curtain plotting;
- Mesh manipulation tools;
- Data exports;
- Sheet plotting and animation tools;
Some of the example plots from previous research projects using the marvl-similar scripts are shown below illustrating their capability and presentations. The csiem-marvl analysis library is currently under development to meet the needs with more data collection and modelling progress, such as sediment profiling and habitat index.
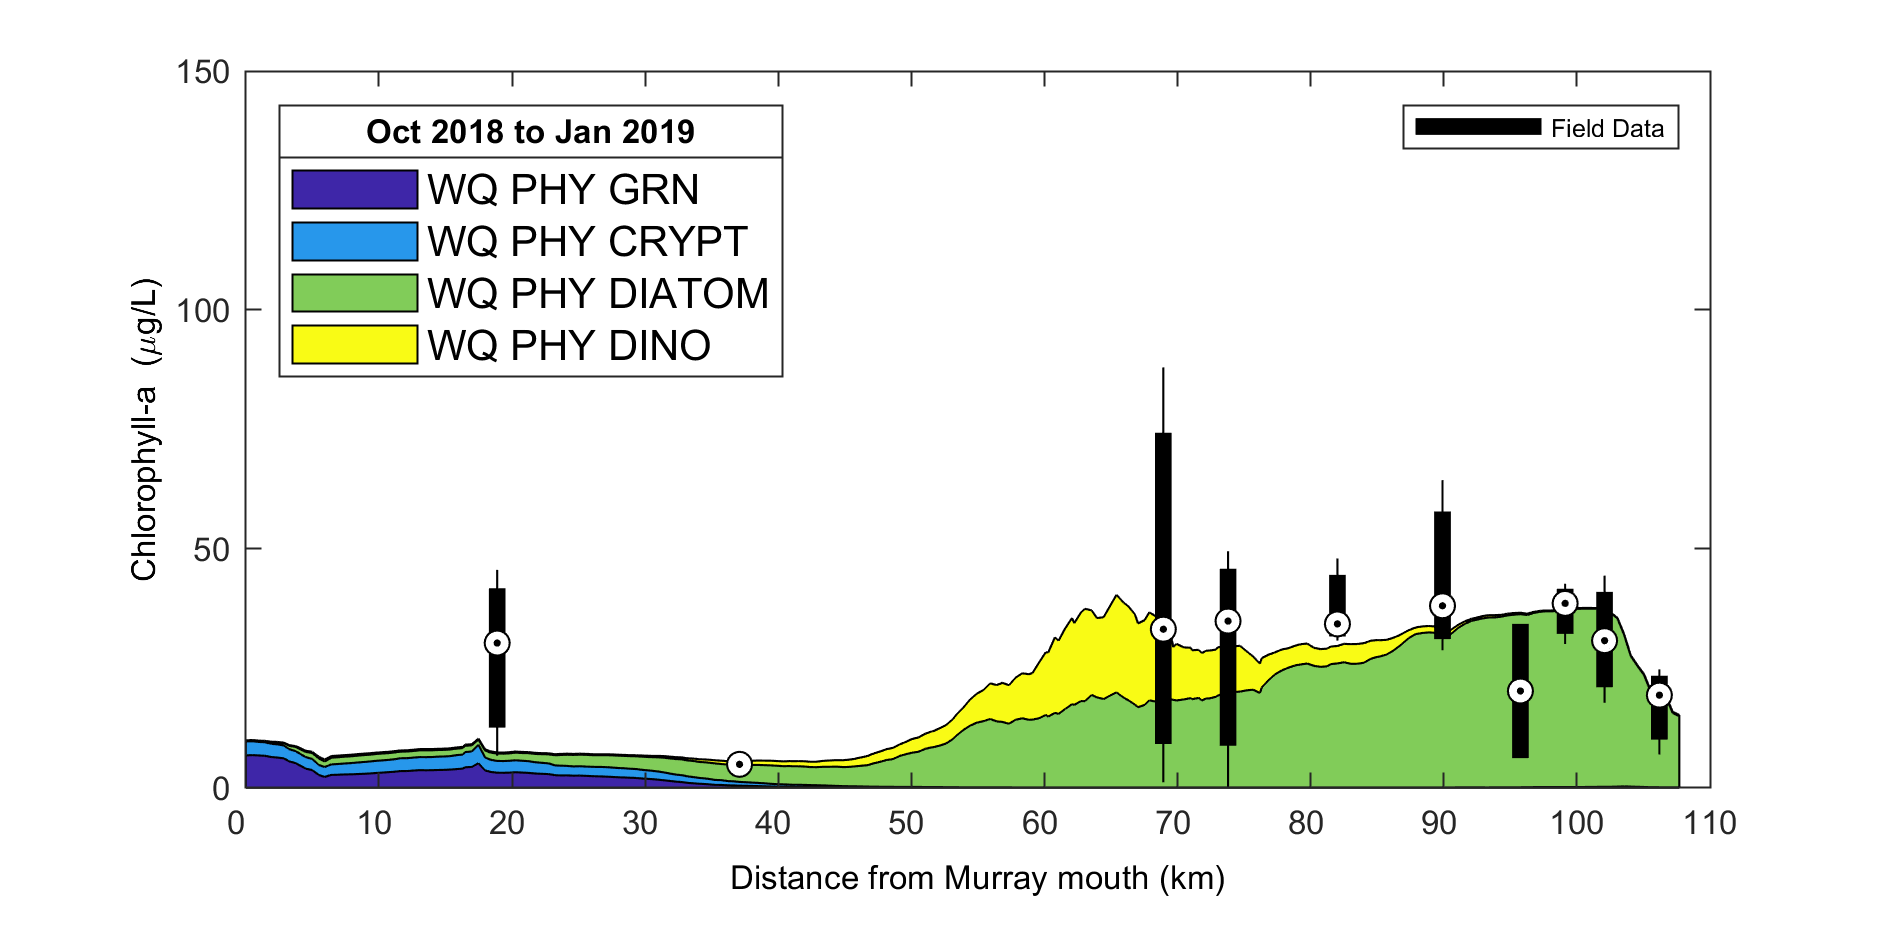
Figure 4.7: Example output from plottfv_transect_StackedArea with distance along the x-axis
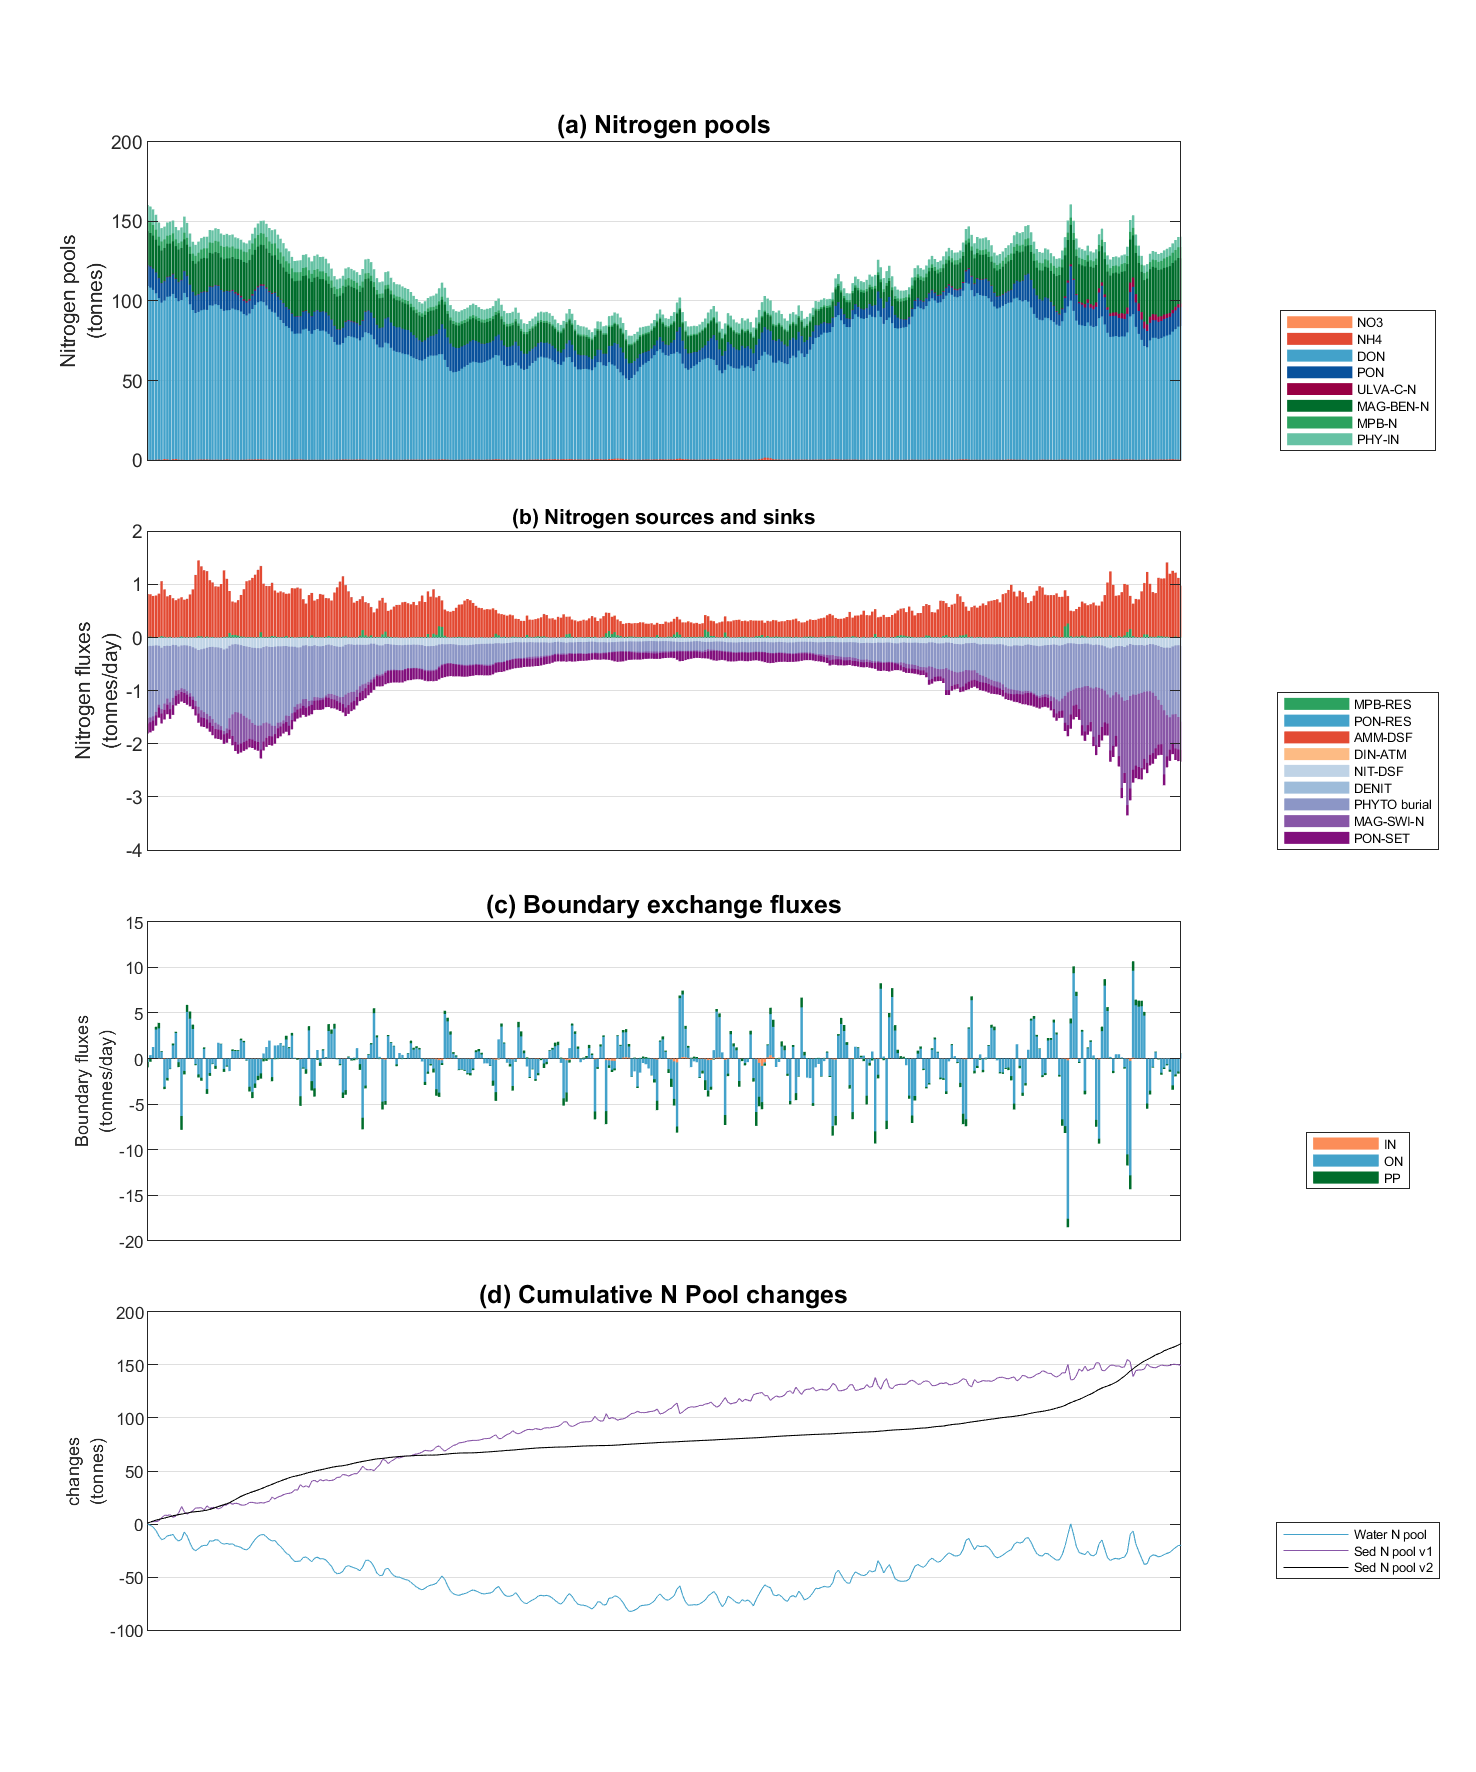
Figure 4.8: Example Nutrient Budgeting output of a polygon region.
4.5 Cockburn SEAF Prototype
The Shared Environmental Analytics Facility is a cloud-based, multi-zonal analytics prototype being developed to support the Cockburn Sound environmental impact assessment process by WAMSI, in partnership with Microsoft, PwC Australia, Sentient Hubs and the Pawsey Supercomputer Research Centre. At the core of the prototype is the development of an open, standardised platform to support modelling and data services between diverse agencies and companies, on a secure robust platform. Built on Microsoft’s Azure platform, and utilising the modelling expertise of Sentient Hub’s, the SEAF prototype is being designed to facilitate complex modelling projects whilst maintainig a high degree of data security, transparancy and repeatability.
Based around Microsoft’s Analytics Landing Zone, which can be described as a Analytics Platform in a Box, a single zone allows for an agency to carry out highly complex workflows, whilst maintaining an very high degree of security and tranparency. Metadata logging at each phase of a project allows for the reproducability of results, and the standardisation inherent in each ALZ means results can be repoduced outside of a single agencies ALZ. Data is shared between zones via automated processes currently under development by Microsoft, which will facilitate the creation of dynamic assessments between different agencies without comprimising data security.
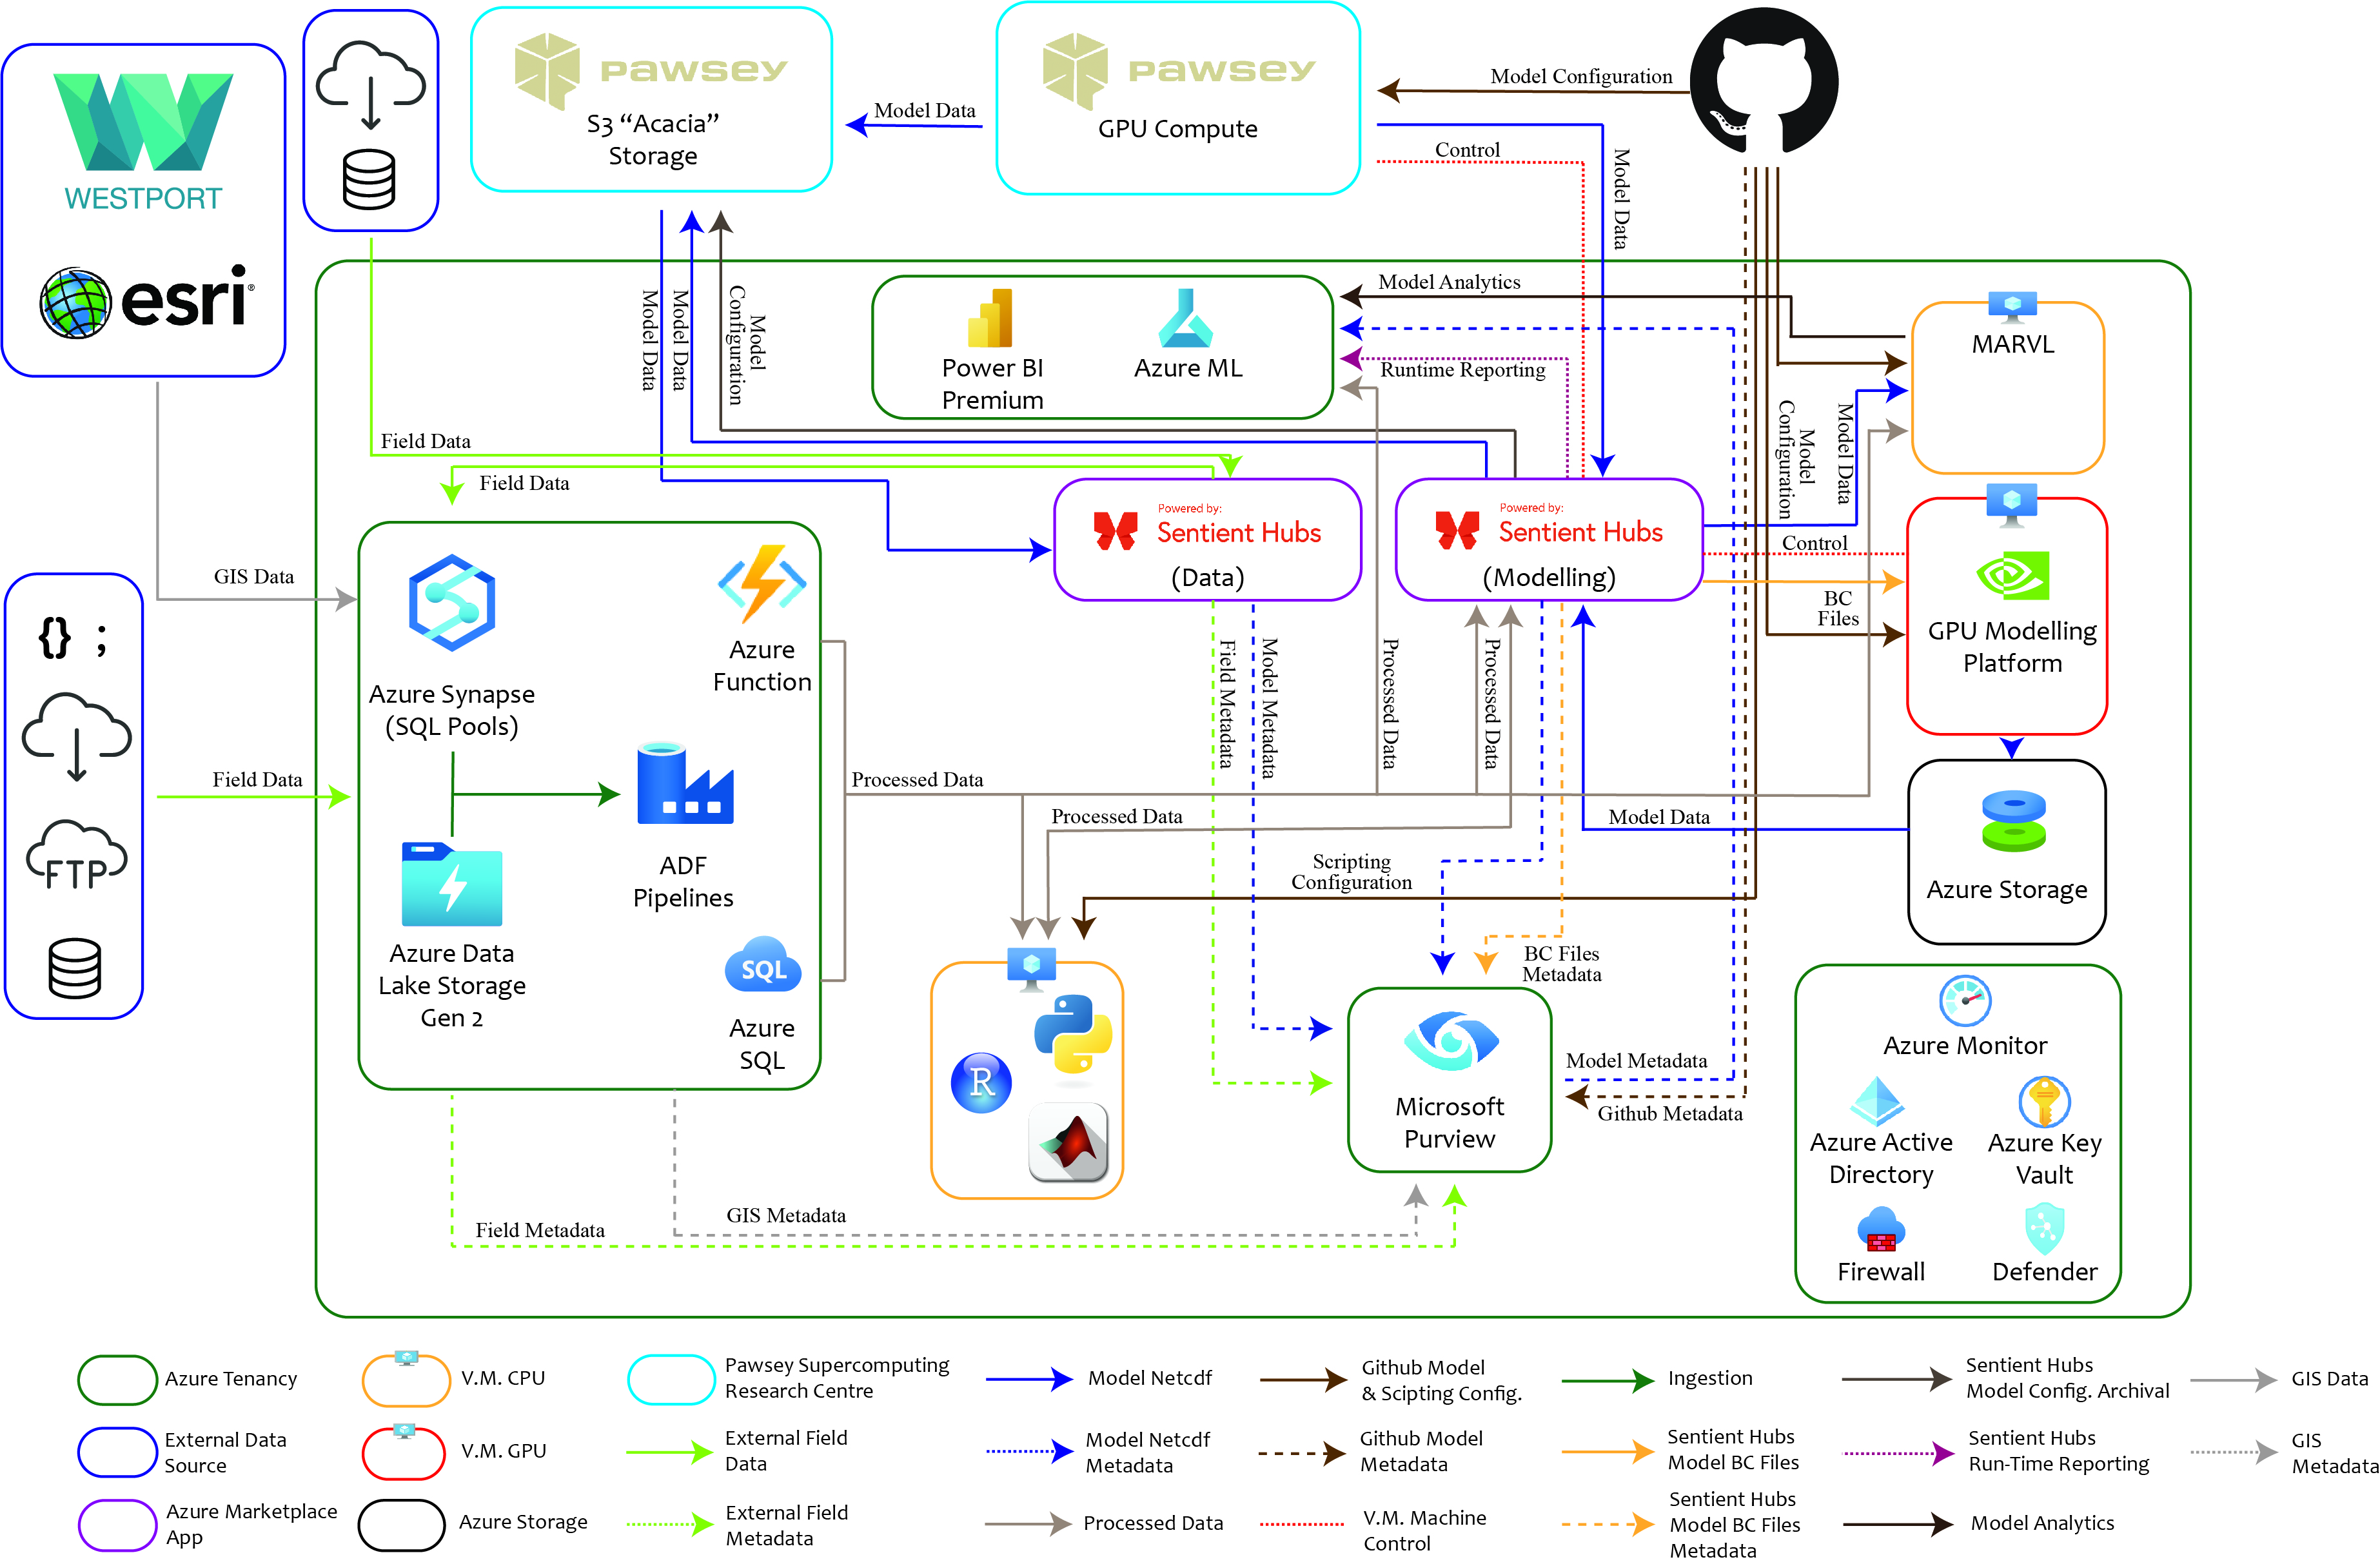
Figure 4.9: Data flow through a single Analytics Landing Zone
The CSIEM Environmental Information Management system has been design to integrate seamlessly with the SEAF prototype once it has become operational. The data governance documentation has been designed to be easily transformed to work with Microsoft Purvue, and the base format of the data inside the data-warehouse also allows for quick ingestion into Azure Synapse and the header information into MS Purvue.
Both the SEAF Prototype and CSIEM EIM use GitHub as their main repository for configuration information and data in the case of CSIEM, and the user credentials used in one system will be available for use in the other.