GLM File Structure
GLM input files
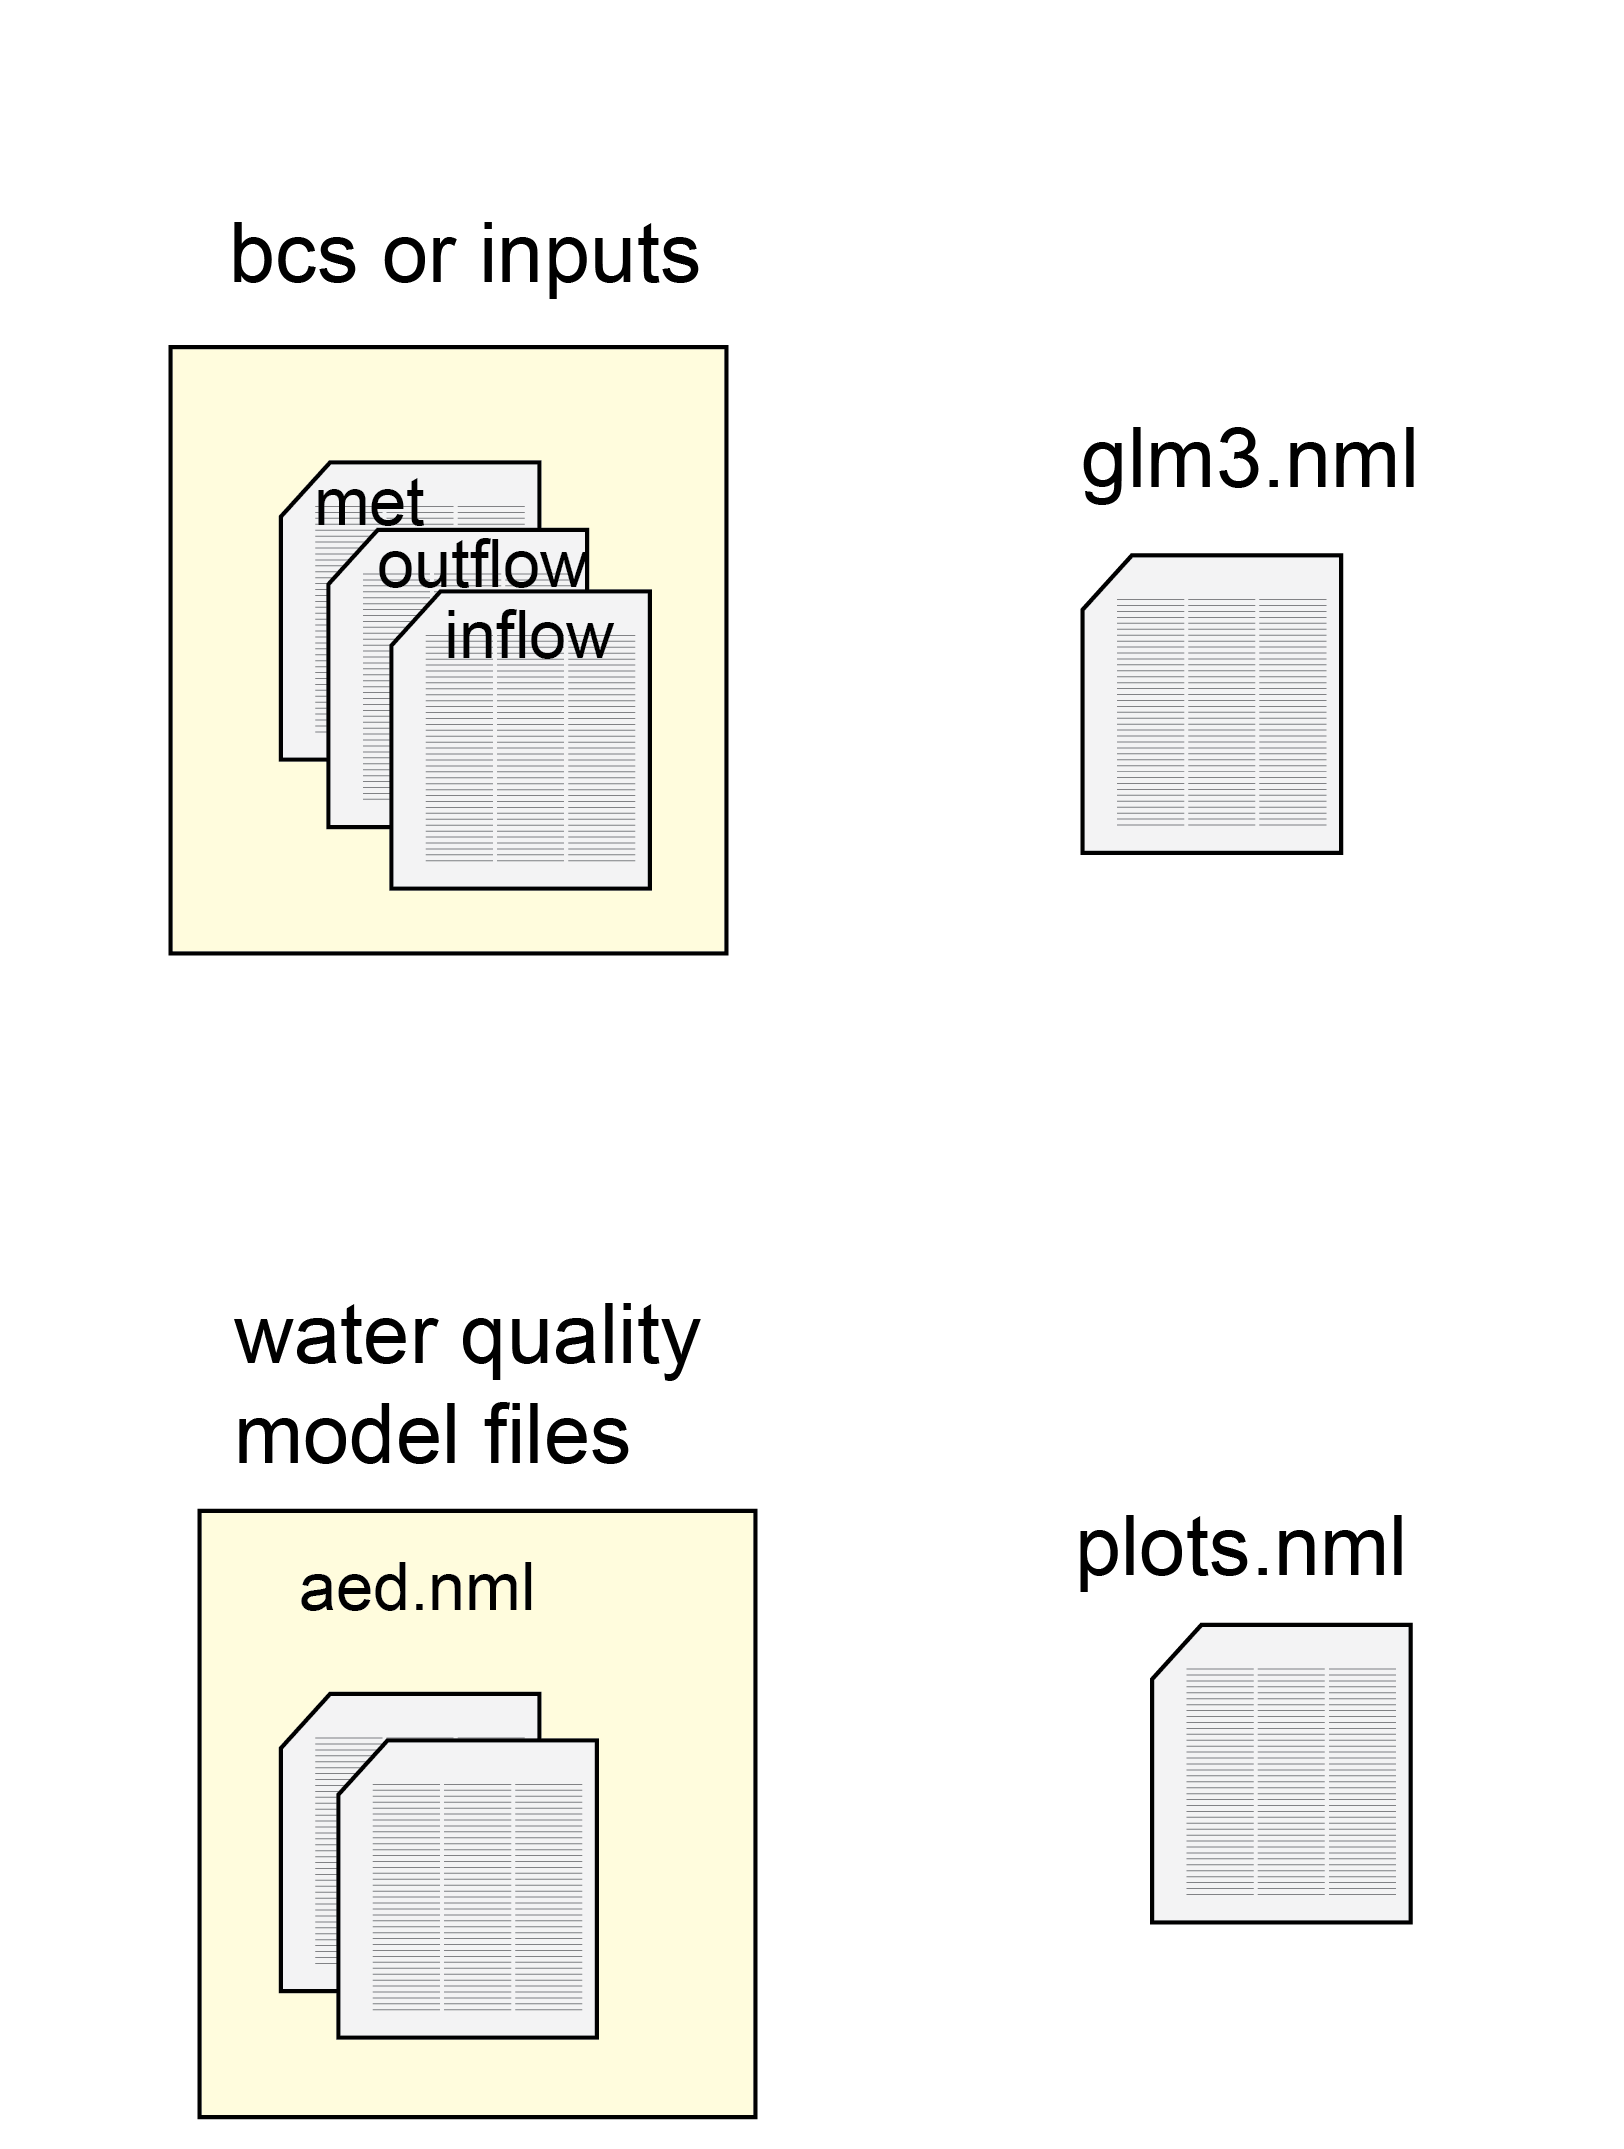
GLM configuration file: glm3.nml
A GLM model simulation is controlled through the main configuration file : glm3.nml. This file is read as text by the GLM program, from top to bottom. Any text with a ‘!’ before it is not read by the program, but is used as a comment for the user.
The key elements of this file are depicted as ‘blocks’ and each block of configuration options and parameters is summarised in detail on this page. Each block is started with an ampersand & and finished with a slash /. The blocks contain text that can be either
- single parameters (with units)
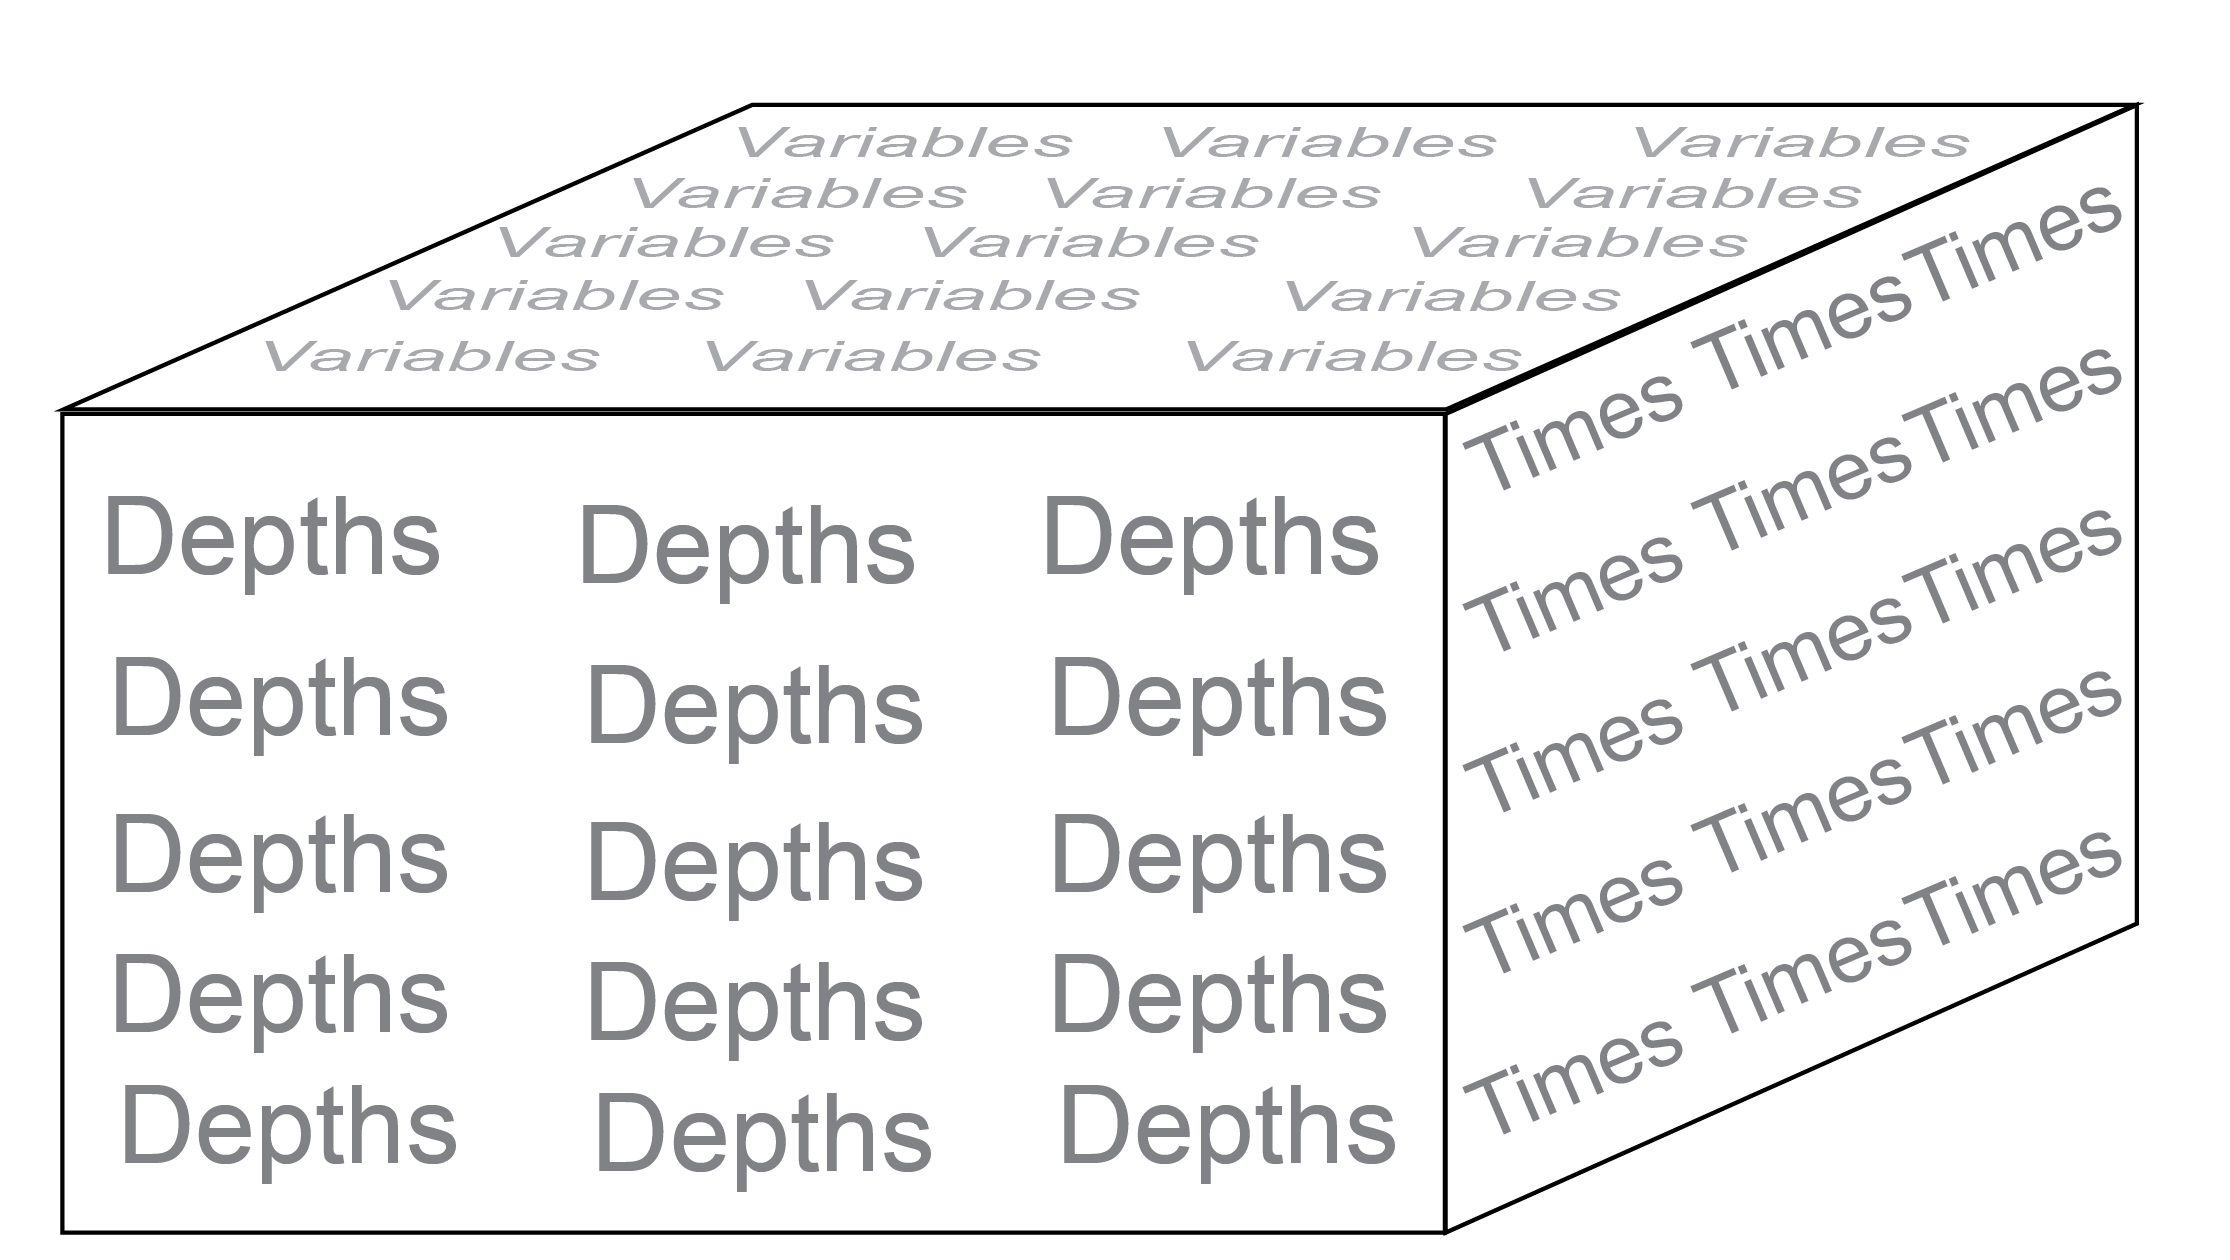
- listed parameters, for example, for every depth layer or every river inflow
- listed variables, for example, variables to be read in or written to the output
- file paths and file names
- configuration switches (integers or logical values)
Some key inputs for setting up a GLM simulation are listed below.
&wq_setup:wq_lib sets an external water quality model, for example, ‘aed’.
&wq_setup:wq_nml_file is the filepath and filename for an external water quality model namelist.
&glm_morphometry:H is a list of some of the heights of the lake.
&glm_morphometry:A is a list of some of the areas of the lake, at the same layers listed in H.
&time:timefmt is a switch for the time setup: either number of days (= 3) or start and stop days (= 2).
&time:start and stop are the dates to start and stop (timefmt = 2).
&time:num_days is the number of days for a simulation (timefmt = 3).
&output:csv_point_nlevs is the number of csv_point_at depths to use, as listed left to right.
&output:csv_point_at is a list of the depths (m) from the bottom at which an output csv file is written.
&output:csv_point_vars is a list of the simulated variables to write to the output csv.
&output:csv_point_nvars is the number of csv_point_vars to use, as listed left to right.
&init_profiles:num_depths is the number (integer) of depths to set for the initial profile.
&init_profiles:the_depths are the depths (m) of the initial profiles, where other features are configured, from bottom to top.
&init_profiles:the_temps are the initial temperatures at the_depths.
&init_profiles:the_sals are the initial salinity at the_depths.
&inflow:num_inflows is a number (integer) of inflowing streams.
&inflow:inflow_fl is a list of the file names for the inflowing streams.
&inflow:inflow_vars is a list of variables to be taken from the inflow files.
&outflow:num_outlet is a number (integer) of outflowing streams.
&outflow:outflow_fl is a list of the file names for the outflowing streams.
&outflow:outflow_fl is a list of the file names for the outflowing streams.
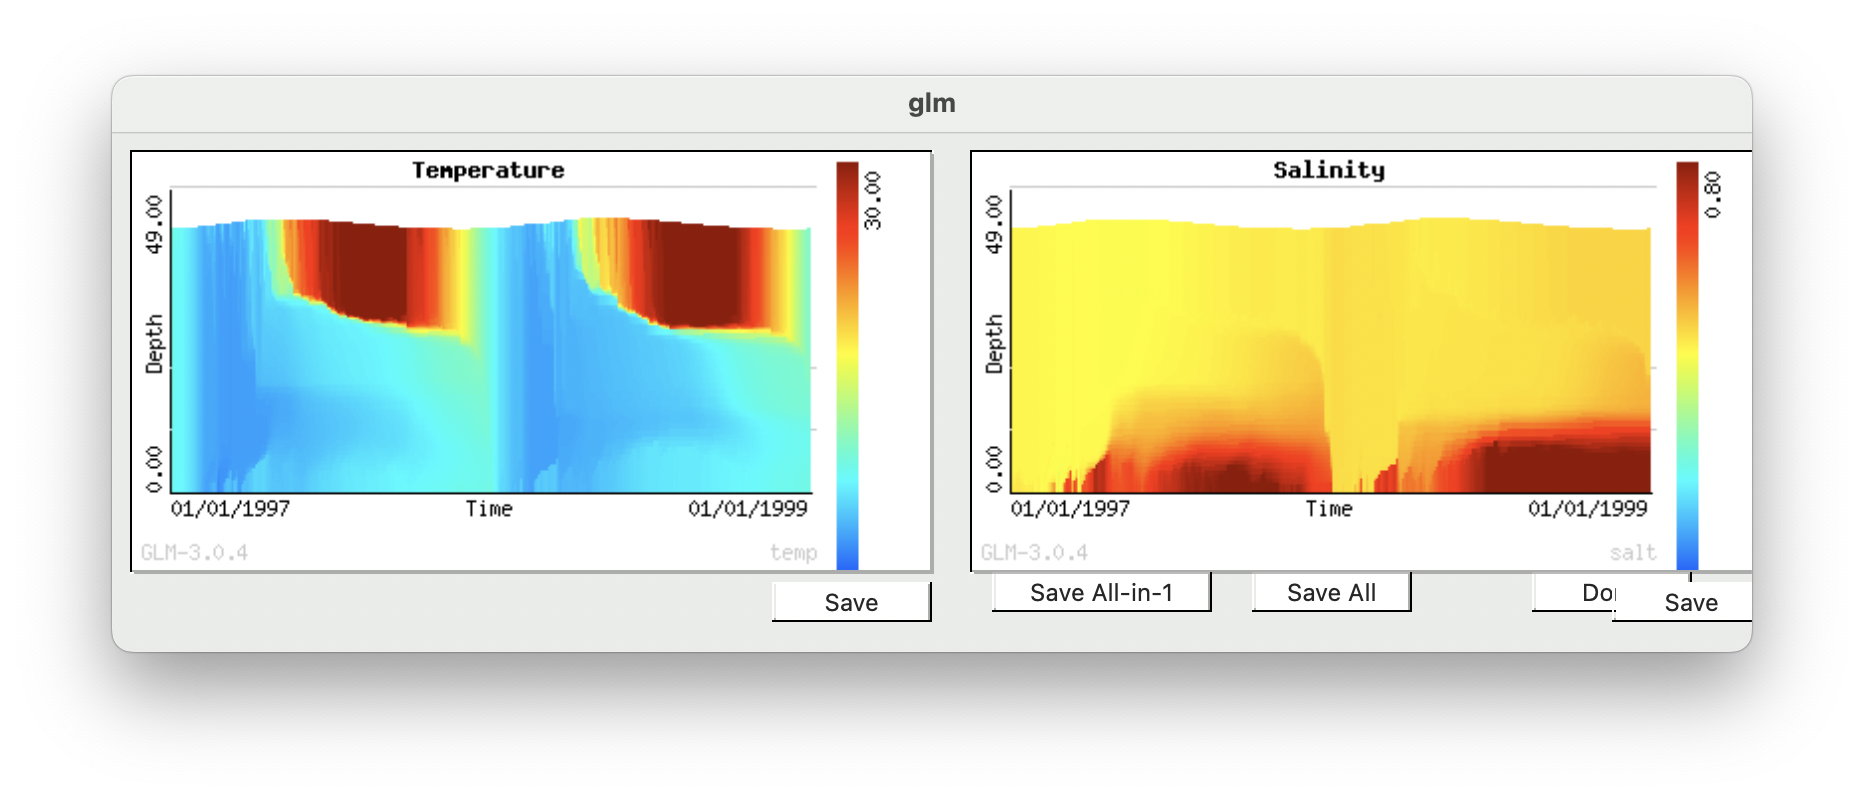
GLM plot window file: plots.nml
The plots.nml text file configures the automatic plot window that runs during the simulation. The x axis is time, the y axis is lake depth layer and the z axis (colour bar) is the scale of the variable, for example concentration. The user can configure the plot window using the following:
&plots_window:widthandheightset the dimensions of the plotting window (mm).
&plots:plot_widthandplot_heightset the dimensions of the individual plots (mm).
&plots:titleis a list of the titles displayed above each plot.
&plots:varsis a list of the GLM or AED variables for each plot, in the same sequence astitle.
&plots:min_zandmax_zset the minimum and maximum values for each of the variables, in the same sequence astitle.
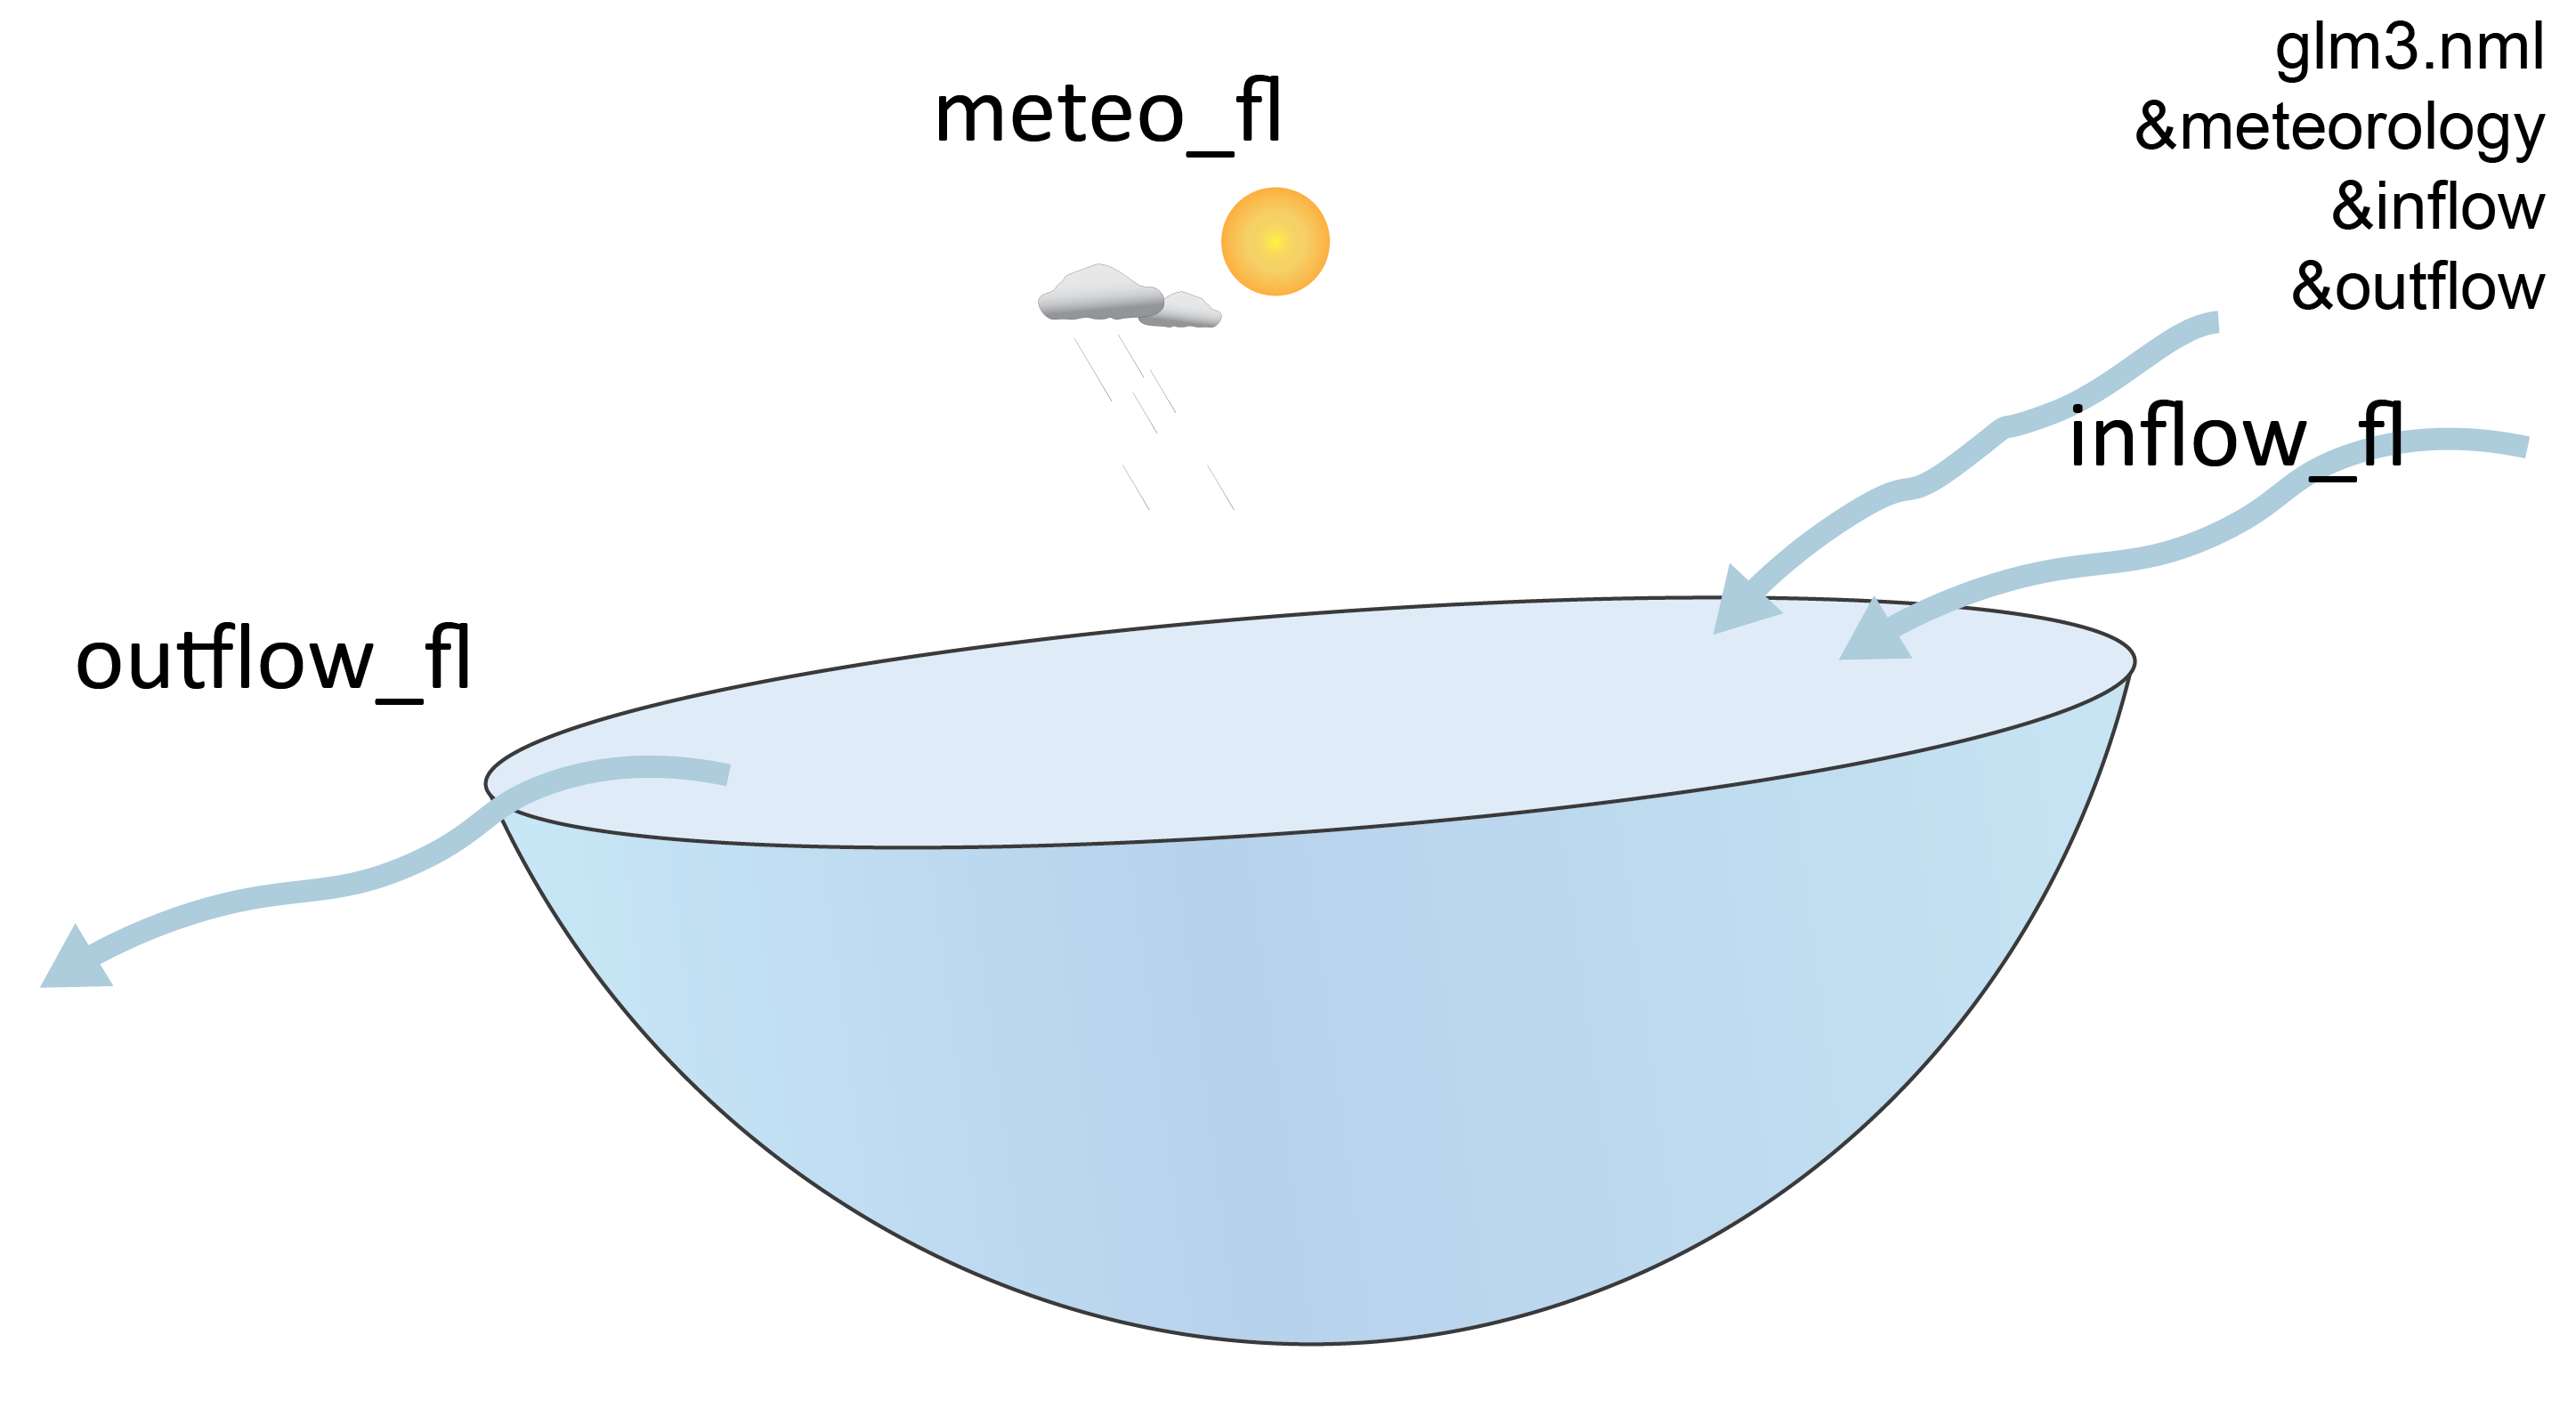
Boundary files
Boundary .csv files can be found in the ‘inputs’ or ‘bcs’ (boundary conditions) directory. The exact names and paths are listed in the glm3.nml block &inflow, &outflow and &meteorology.
Inflow files
The simulated lake may have streams or rivers flowing into it. If so, one time series boundary .csv file is used for each inflow stream. The rows of the csv are time steps and the columns are inflowing variables, such as flow volume, salinity and oxygen. The file names are listed in inflow_fl and the model will read them in from left to right according to the number set in num_inflows.
Outflow files
In a similar way to the inflow files, the simulated lake may have streams or rivers flowing out of it. If so, one time series boundary .csv file is used for each outflow stream. The rows of the csv are time steps and the columns are outflowing variables, such as flow volume, salinity and oxygen. The file names are listed in outflow_fl and the model will read them in from left to right according to the number set in num_outlet.
Meteorological file
One meteorological file sets conditions at the surface of the lake, i.e. the water-atmosphere boundary. It includes values such as air temperature, wind speed and light. The file is also a time-series boundary, with rows as time steps and columns as each boundary variable. It often has a name like ‘met.csv’.
GLM output files
Once GLM is running, it will write its results to several different output files.
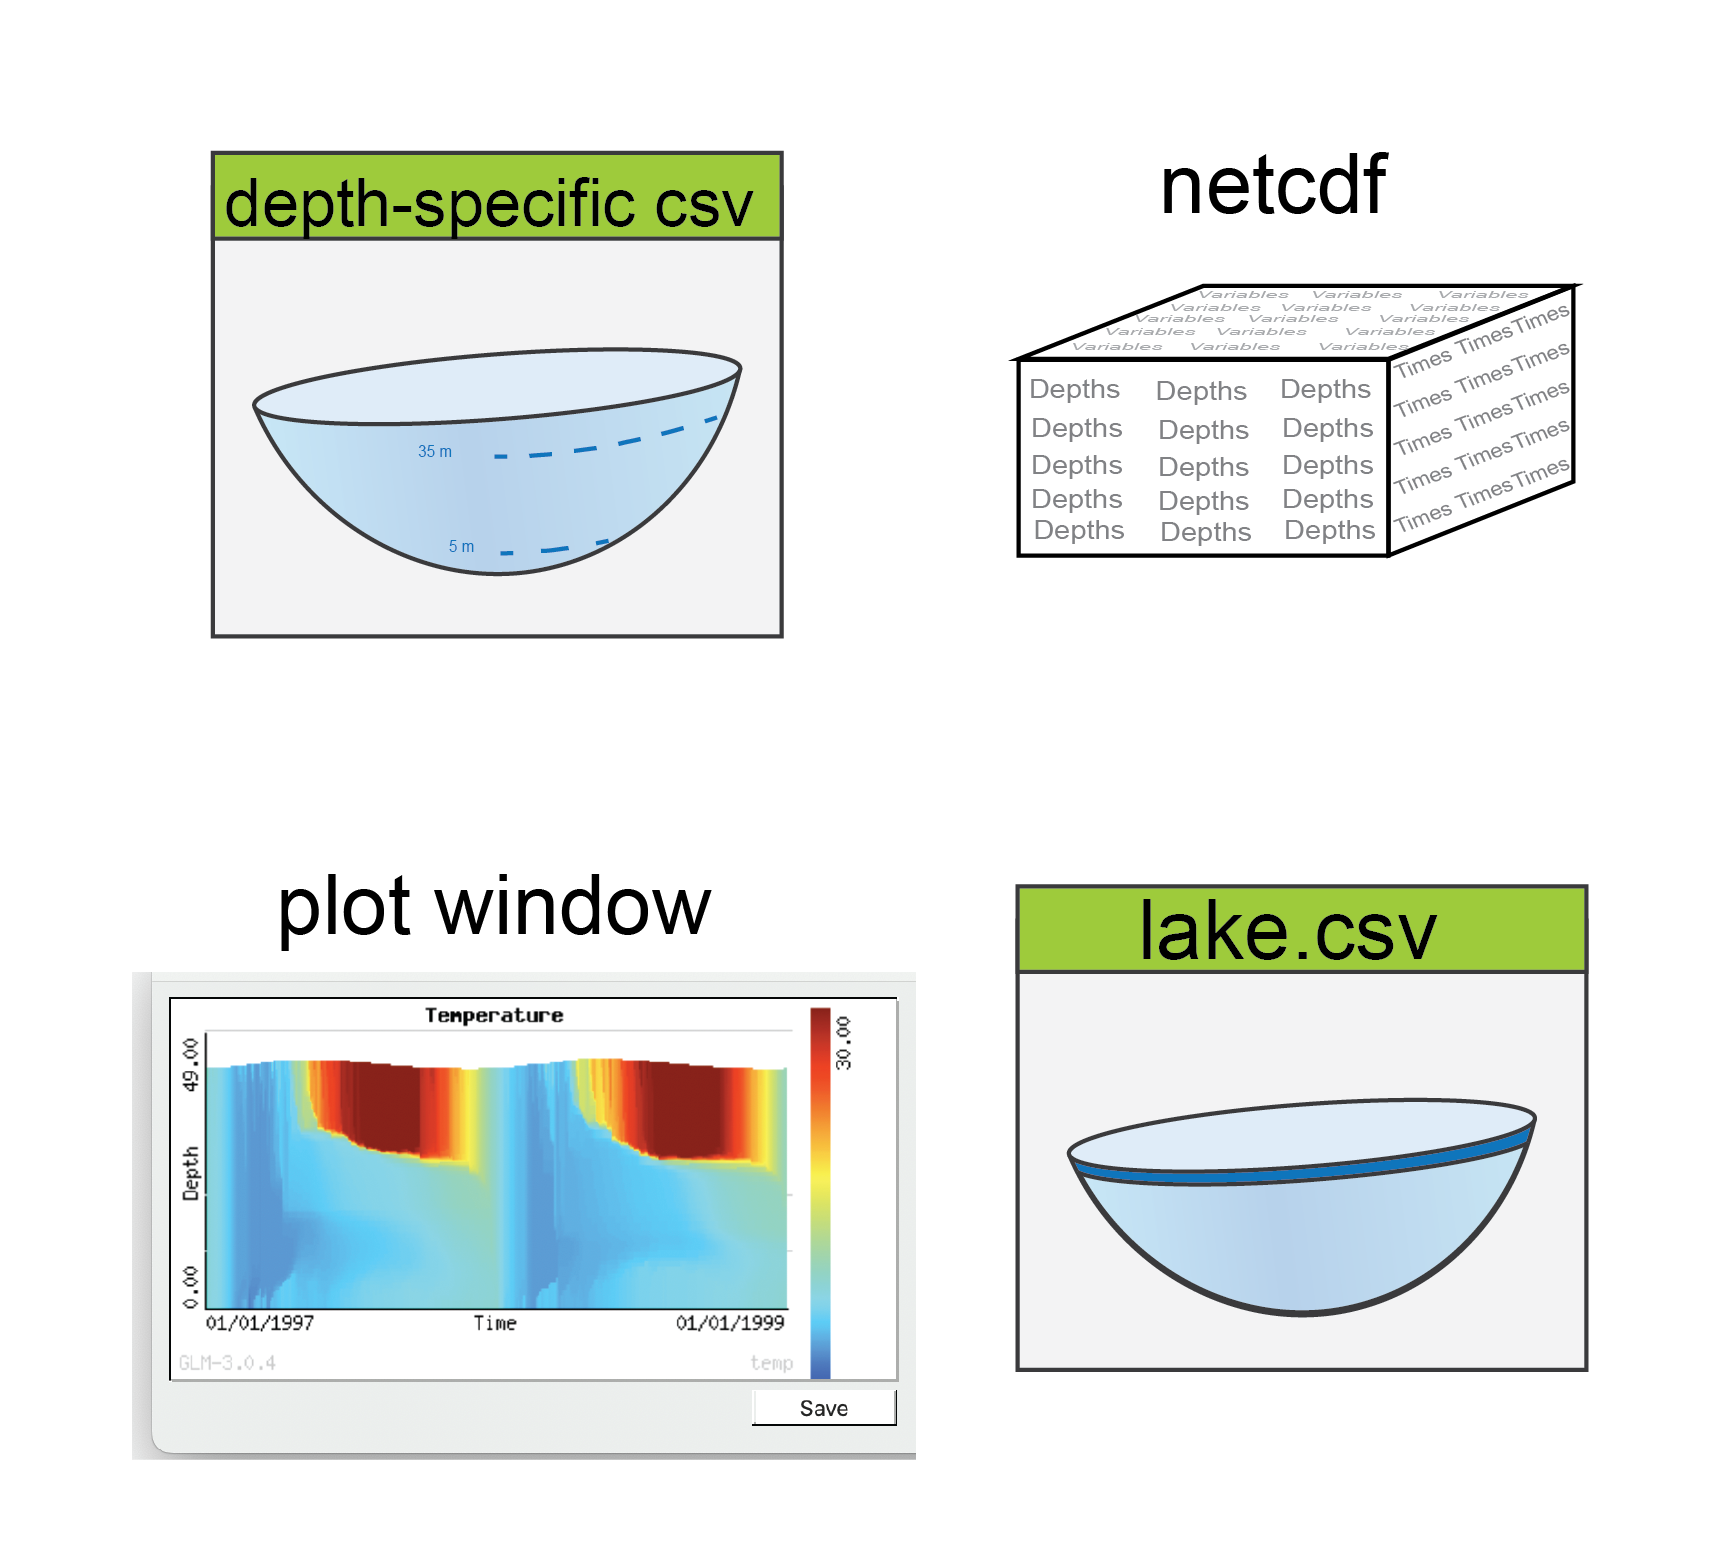
Output Netcdf
The results of all variables at all time steps and depths are written to the netcdf file. This file may have a size of hundreds of MB or GB. The file can be accessed with Matlab or R packages that have been created to organize these large file types.
General lake .csv
One csv is written for each simulation. The file name is set with the parameter &output: csv_lake_fname, for example ‘lake.csv’. This file contains values that apply to the whole lake, such as lake volume, lake level and surface temperature.
A list of the variables contained in the lake .csv can be found here. The table ‘2D variables from lake.csv’ lists the variables, a description and the units of each.
This .csv is especially useful for calculating the water balance and heat balance of the lake.
Depth-specific .csv
Profiles can be output at specified depths, using &output: csv_point_fname and csv_point_at. For example, if csv_point_fname is ‘WQ’ and csv_point_at is 1, 5, 12, then the model will create files ‘WQ_1’, ‘WQ_5’ and ‘WQ_12’. The variables for this file are listed in the parameter csv_point_vars. This file can be used to access output data at one depth more easily than via the netcdf file.