Exercise 3 – Drivers of streamflow
The amount of water moving through a stream is a product of the interactions between climate, catchment geomorphological properties (slope, soils, etc) and vegetation. Importantly, in Western Australia, streamflow is also contributed to from both surface water runoff, and from groundwater discharge. In this exercise we will look at streamflow data from a river nearby to your site of interest, and then determine the strength of the relationship between annual rainfall and annual streamflow.
Getting streamflow data
12) As part of your analysis, we also will examine the relationship between annual rainfall and annual streamflow (aka runoff) for a chosen catchment. Streamflow data is recently reported on the BOM website for some rivers, but the measurement of streamflow is a State Government responsibility. To get streamflow data, go the Department of Water web site. Use this WIR tool to locate a gauging station near your rainfall site. Add the site to your cart and submit a data request - check that the data is being delivered as a “package of pre-computed reports”. You will then be emailed a zip file of the station’s data. Ensure the station has 10-20 years of available data for this exercise.
UPDATE 4 AUG 2025 For the last few weeks the WIR data for WA has not been available. A mirror of this data is available via the BOM water data portal - which sumamrises streamflow data also for Australia (State Governments provide their data to BOM - its the same data, but different portal). You can access this one here: BOM water data portal.
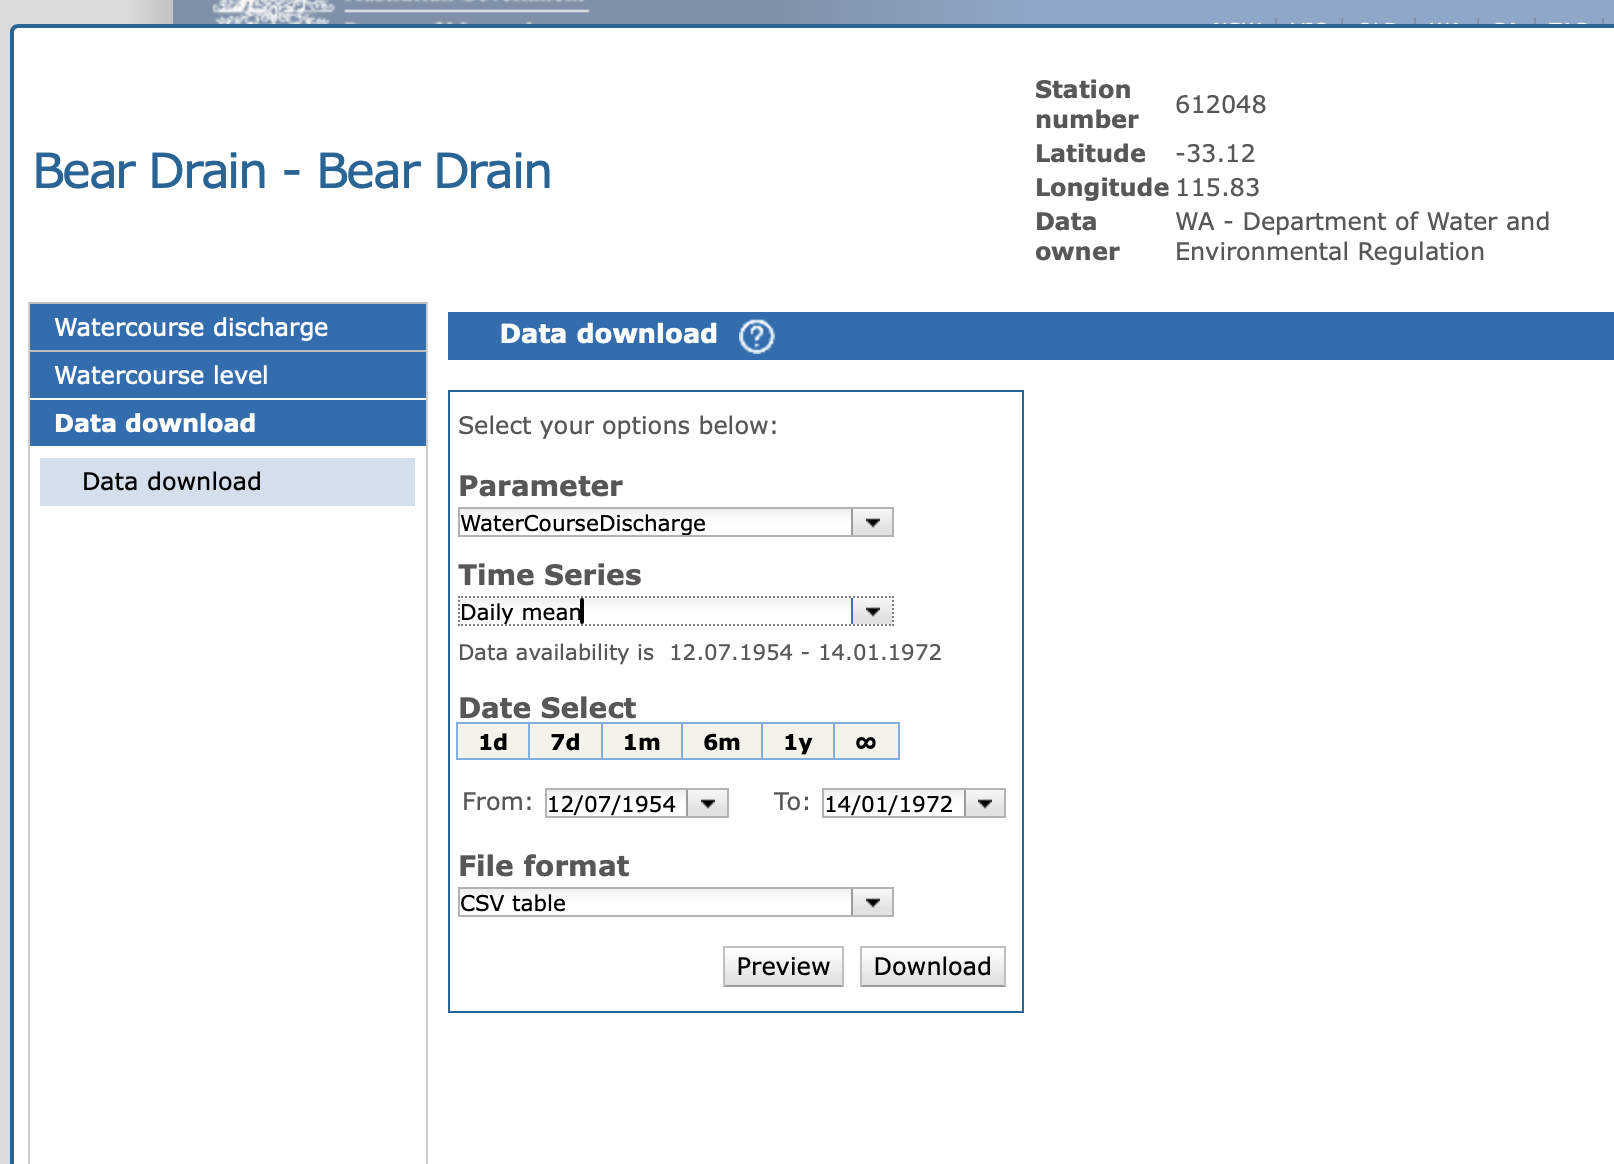
When using this website, select the parameter as “Water Course Discharge”, and then search for a site in a catchment near to your rainfall station. As mentioned above, ensure that the station you select has 10-20 years of available data, that overlaps with the rainfall station data. When downloading select “daily mean”, so that in Excel you can “SUM” the daily data to get annual total.
Processing streamflow data
13) Once you have the data, explore the CSV file received to see the nature of the data provided - i.e., river flow discharge rate. Use the techniques introduced above to summarise the data (e.g., create a PIVOT table) in order to get annual streamflow volumes. Plot the data and compute the annual mean.
Relationship between rainfall and streamflow
Now lets examine the relationship between annual rainfall and annual streamflow (also called discharge by surface hydrologists). Make sure the site you have chosen has streamflow data by checking the data availability and the request the report for water levels and flow - continuous to get the flow data). (If WIR website is not working for this download, see note above). Please note you will need to SUM the daily mean of data to get an annual total - check the units to be sure the uits make sense.
14) Plot a scatter plot of annual streamflow (y-axis) and annual rainfall (x-axis). Add a trendline to the chart. What are the relationships between rainfall and streamflow? Are they linear or non-linear and why? Add the data for your site to the shared class spreadsheet, so we can look at the whole data set - are there consistent relationships across WA?