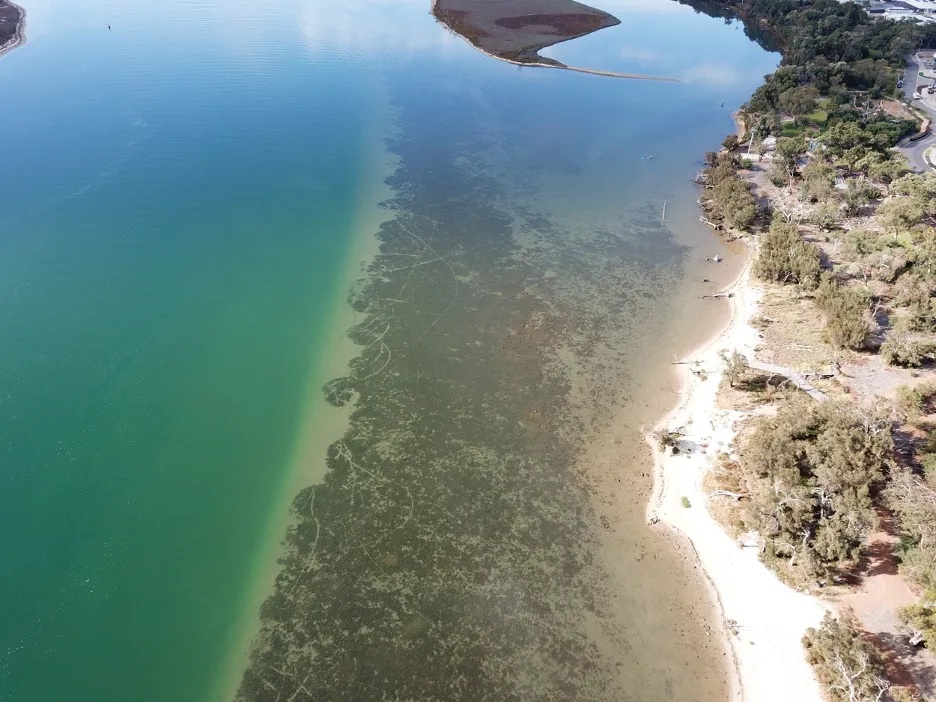
Seagrass and macroalgal communities (‘macrophytes’) play key roles in the function of estuaries and the societal benefits they provide. Over more recent history, the macrophytes of the Peel-Harvey, and especially the green macroalgae, have been a major focus due to the massive blooms that occurred from the 1960s–1980s and the ecological and societal issues that resulted. Opening of the Dawesville Cut in 1994 to help alleviate these problems led to a major step change in the estuary’s hydrology and nutrient levels. There have also been other more gradual shifts in the estuarine environment from catchment development and climate change effects, particularly in recent decades.
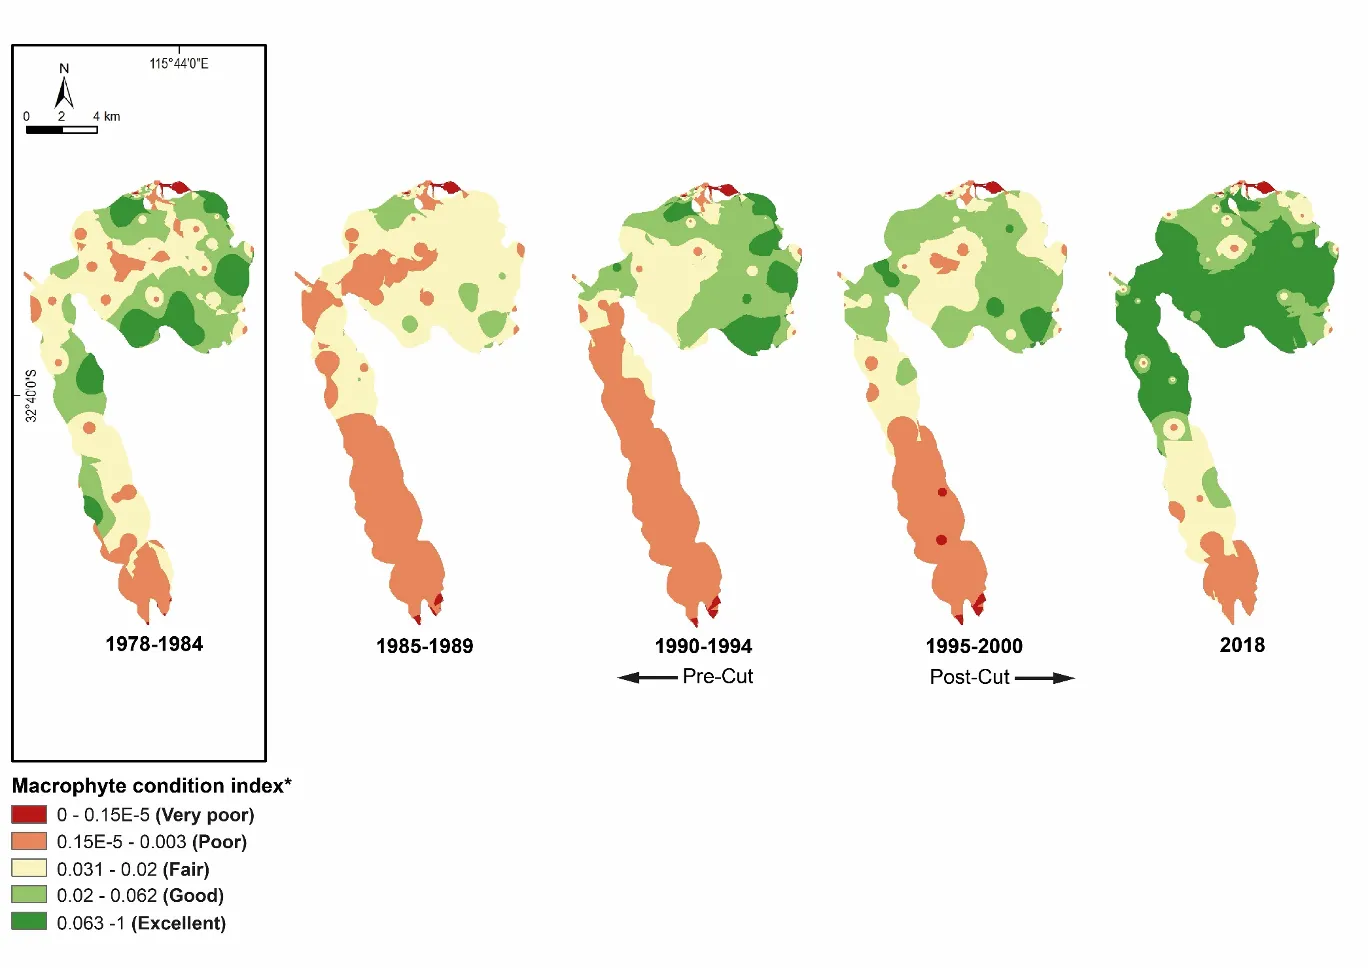
This report explores how the macrophyte community in the Peel-Harvey has changed over the last 40 years (1978–2018), and the environmental drivers that have been most influential. While other studies have examined changes in these plant communities in particular periods (e.g. just before and after the Cut), this is the first to examine the full sampling record. We also developed an index of macrophyte community condition or ‘health’, which was translated into a report card scale from ‘A’ (excellent) to ‘E’ (very poor), and used it to track changes over time across the estuary. Lastly, we propose a macrophyte monitoring plan for the future. This report provides a broad summary of our key findings, and is supplemented by a more detailed and technical account in Krumholz (2019).
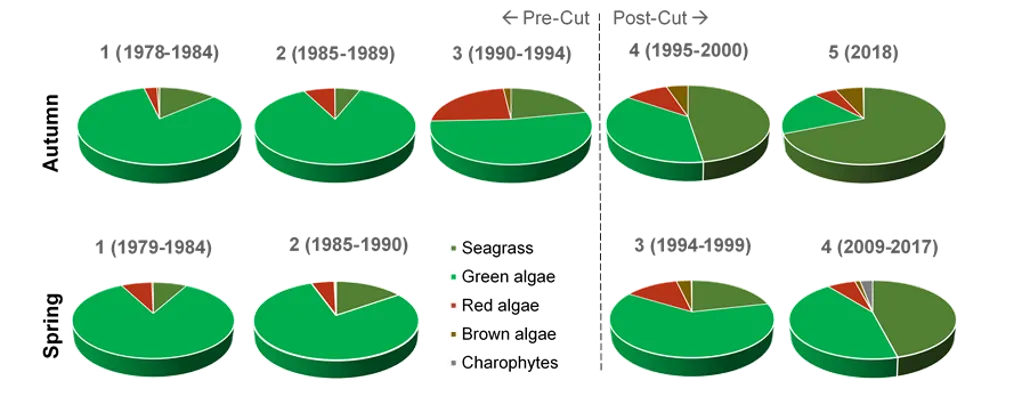
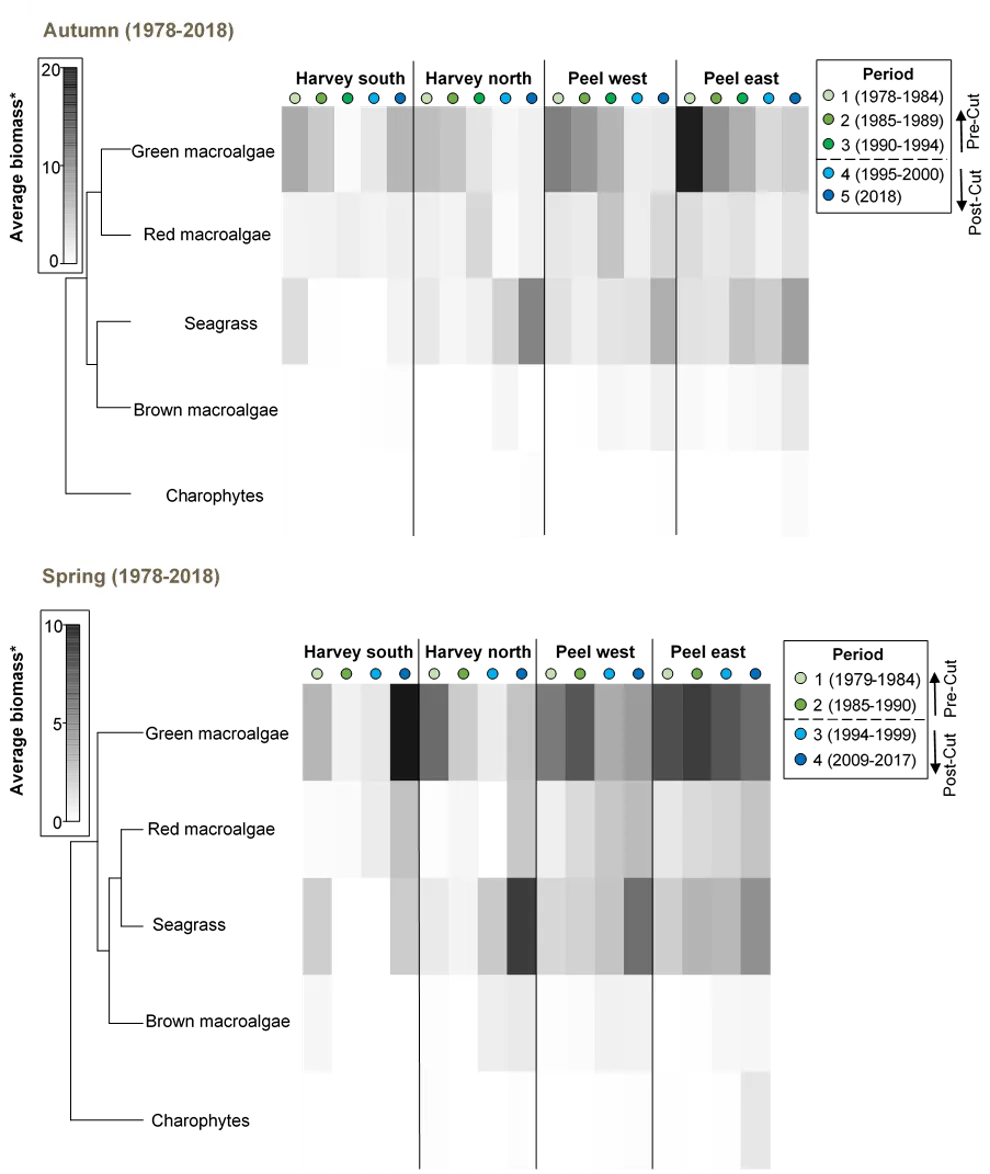
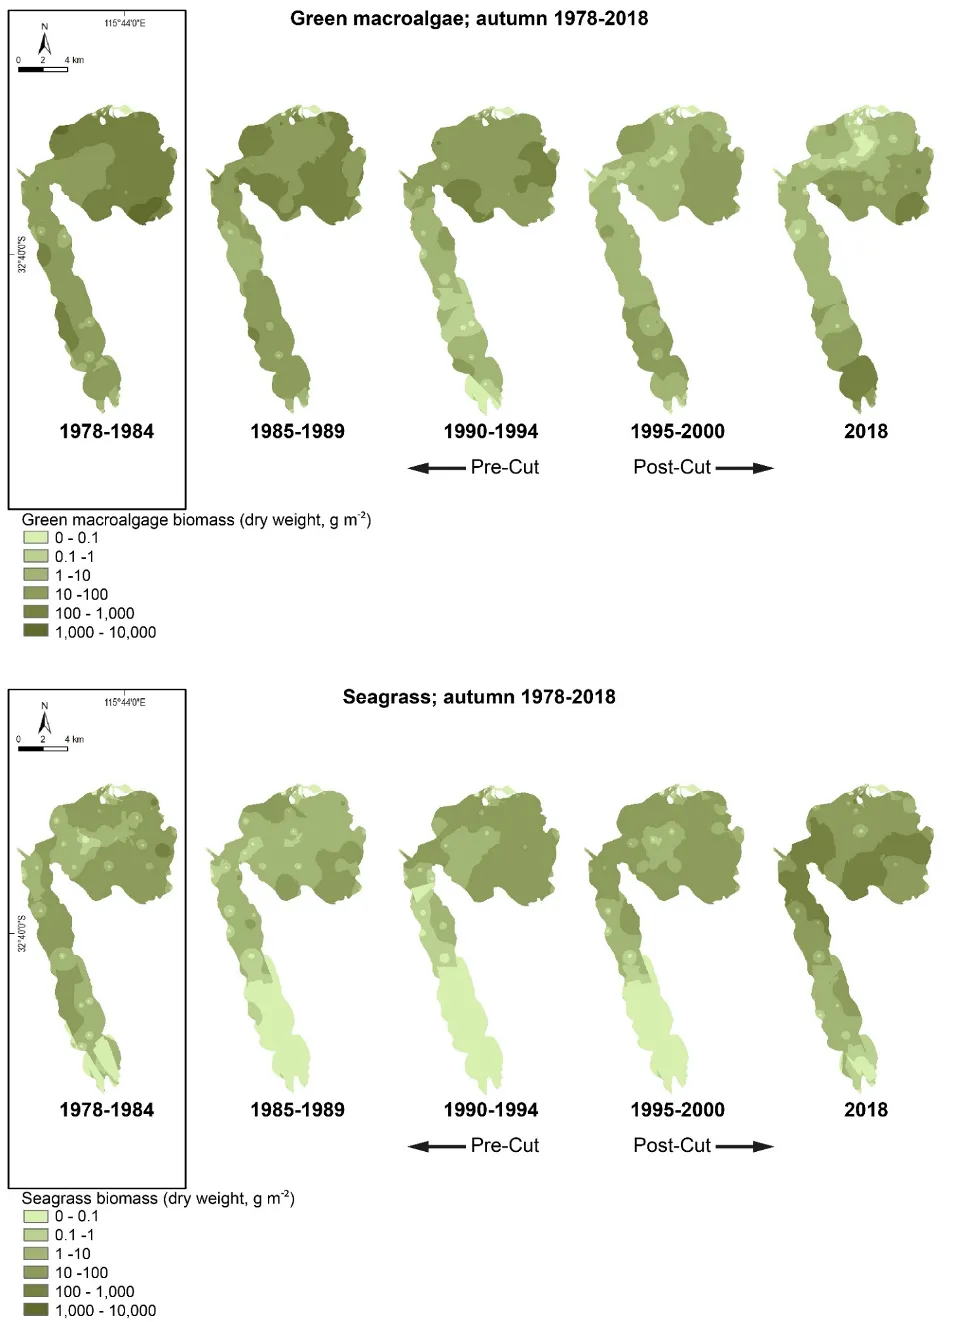
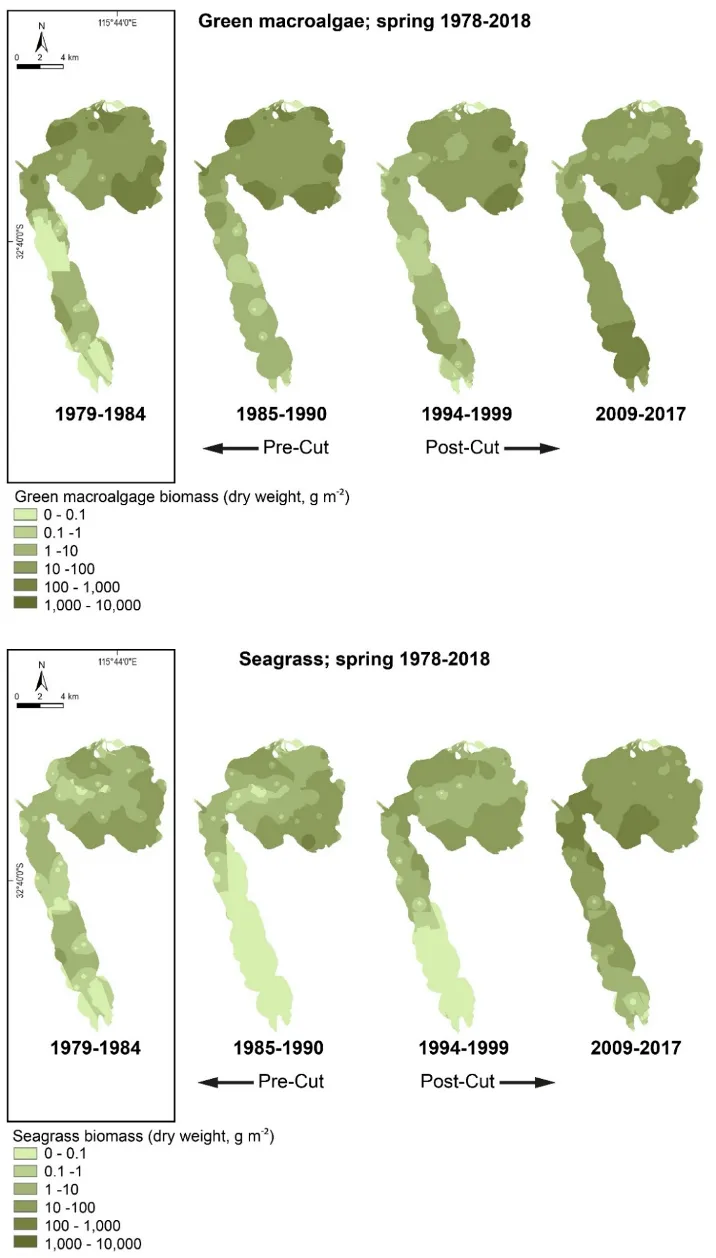
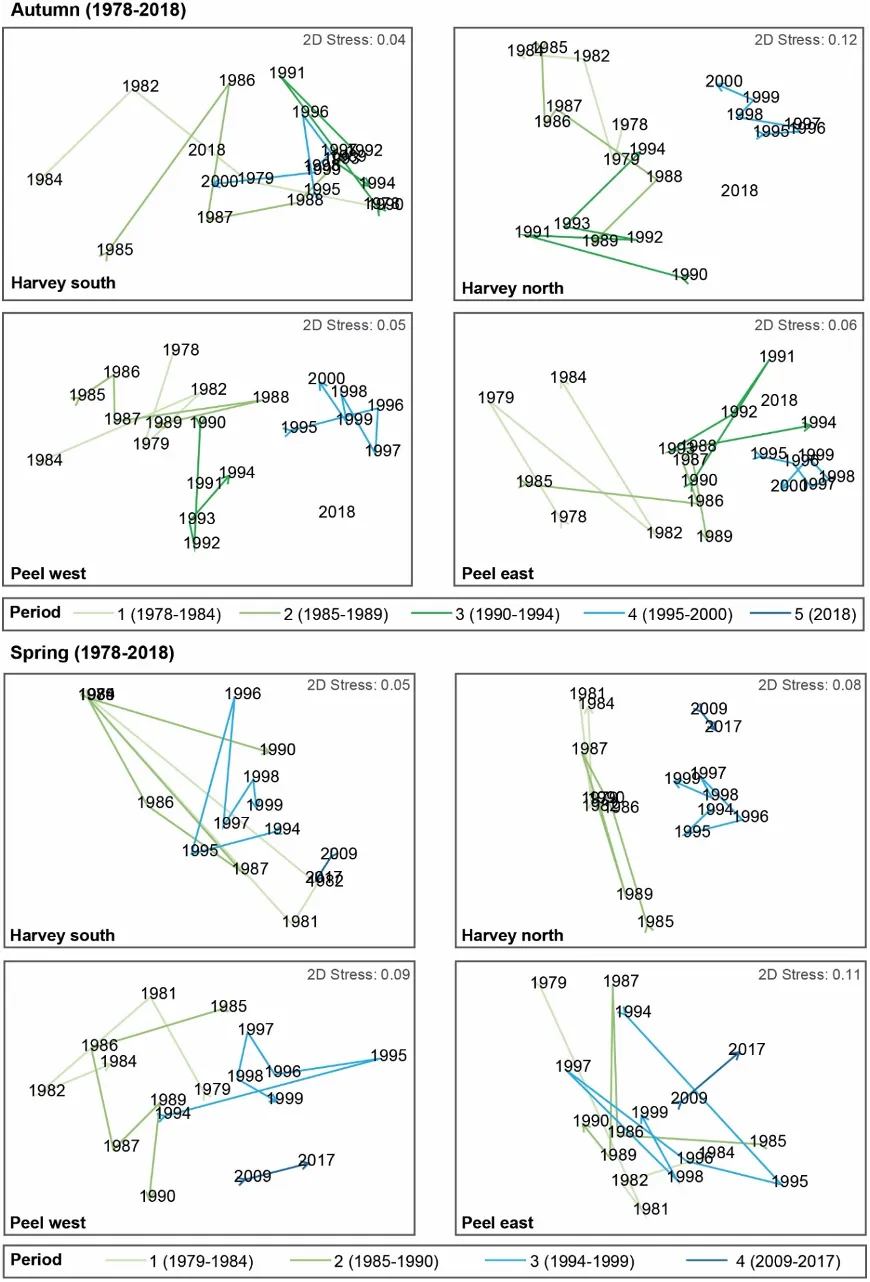
 Our findings show there have been dramatic changes in the macrophyte community from the late 1970s, which in most regions of the estuary has reflected major declines in green macroalgae and increases in seagrass. These shifts were most obvious just after the Cut and the subsequent boost in tidal flushing. The most recent survey results (2017–2018) show that, for the first time in the monitoring record, the community is clearly dominated by seagrass (70% of overall biomass in autumn 2018) as opposed to green macroalgae (52–86% of overall biomass from 1978–1994). This progression has led to improved health of the macrophyte community, from very poor to fair (index grade E–C) across much of the estuary in 1985–1989, to fair to excellent (grade C–A) in 2018.
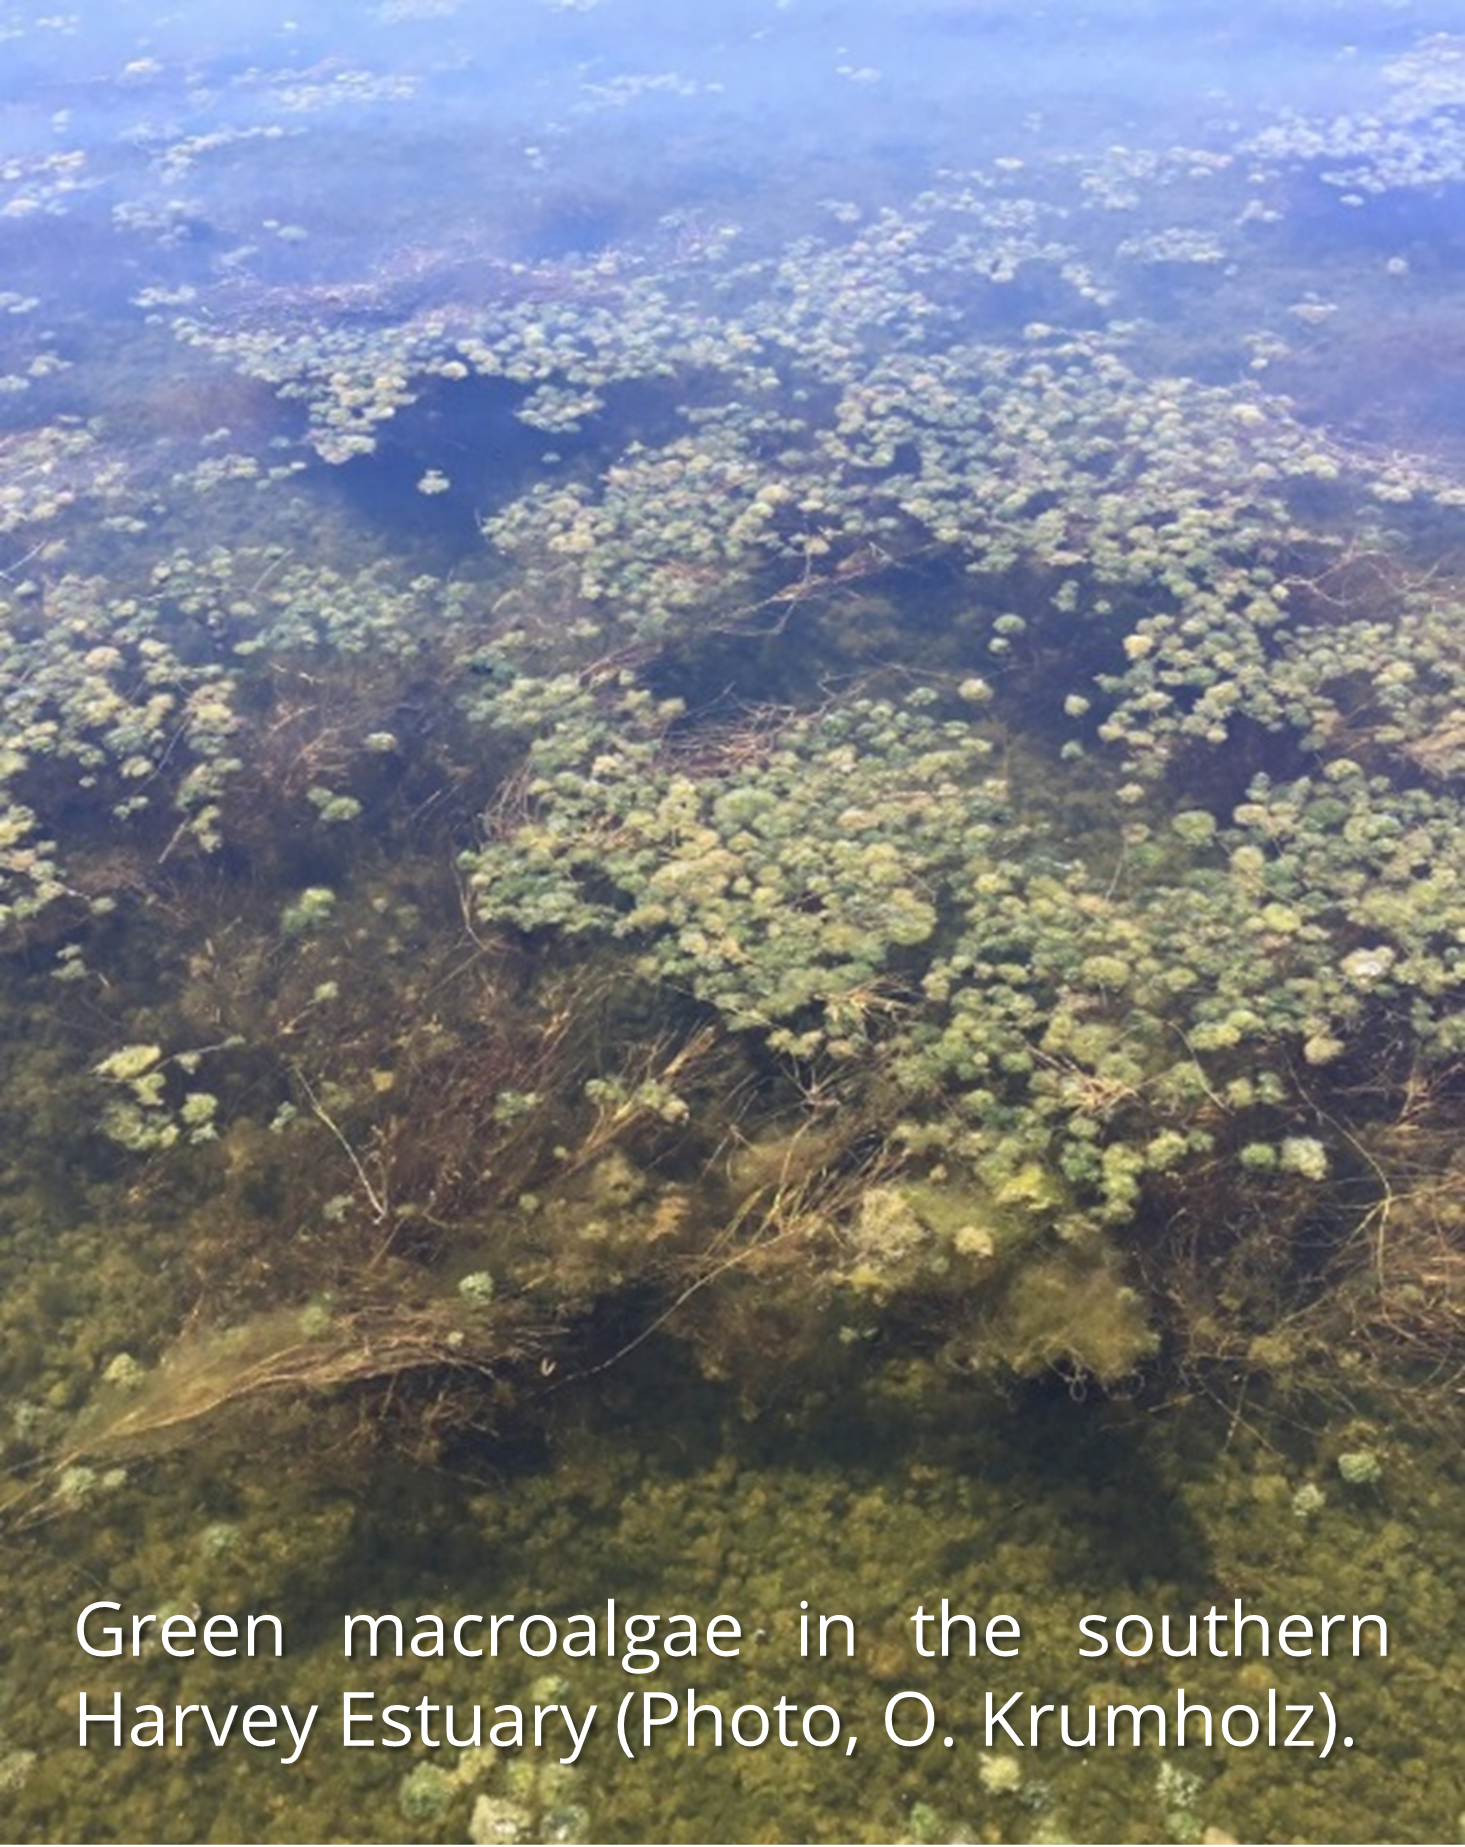
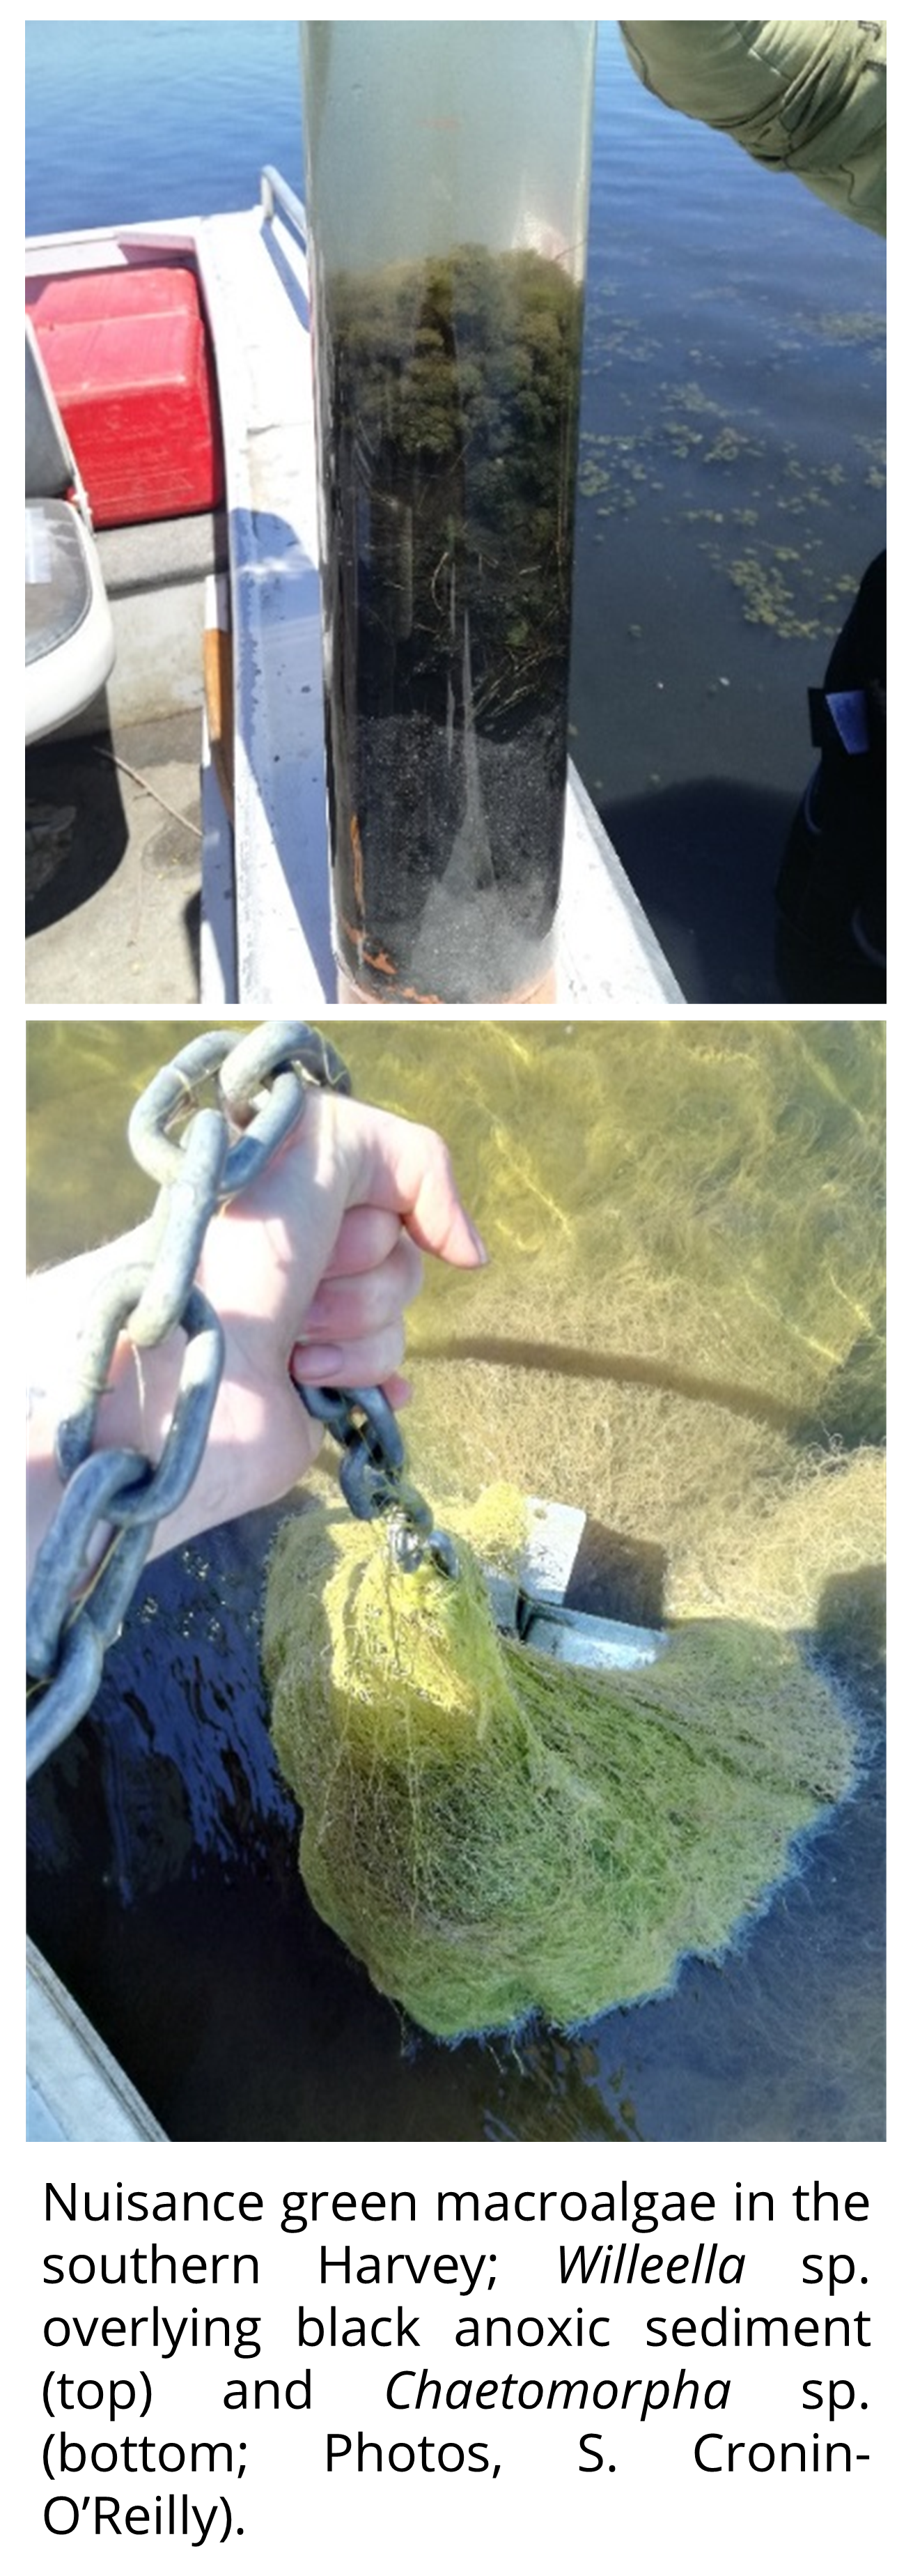
One region of the estuary that is not showing signs of improvement is the southern Harvey Estuary. The macrophytes in this shallow and poorly flushed region remain in poor condition and are showing worrying signs with respect to increases in nuisance green macroalgae. While average green algal biomass decreased from the late 1970s to just after the Cut in this region, it has increased in more recent years, especially in spring when it far exceeds values recorded for any other macrophyte group across the whole estuary in the full 40 year timeframe. The shallow south-eastern Peel Inlet also has a high biomass of green macroalgae, again especially in spring, which has largely persisted throughout the monitoring record and even increased in recent years.
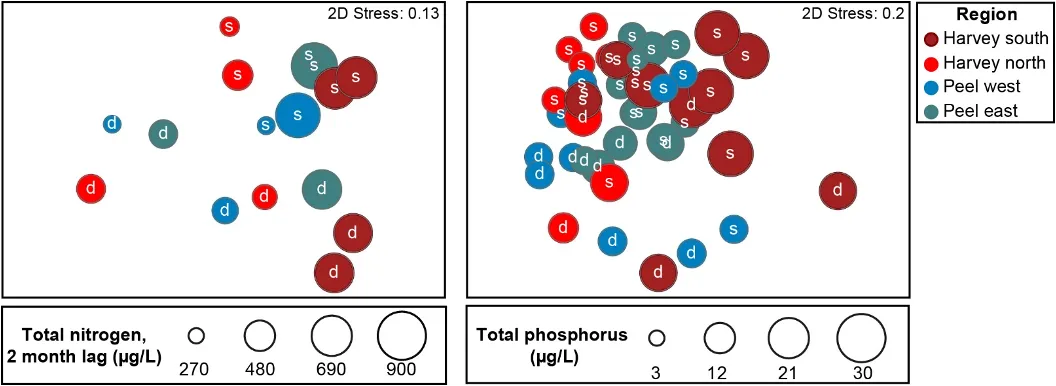
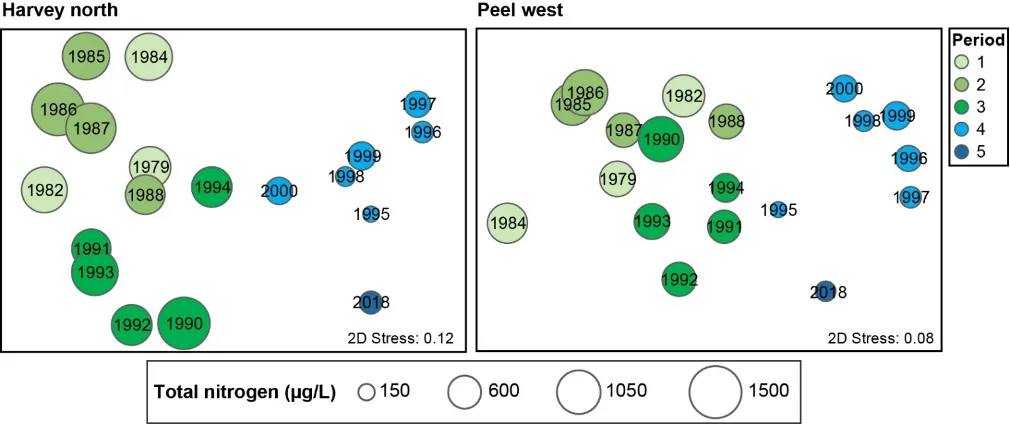
The main environmental driver of the above longer-term shifts in the macrophyte community was the concentration of total nitrogen in the water column. Green algal-dominated assemblages were generally linked with higher nitrogen concentrations, and more seagrass-dominated assemblages were linked with lower concentrations. Some weaker correlations were also found with increasing salinities and temperatures, as well as decreasing total phosphorus concentrations.
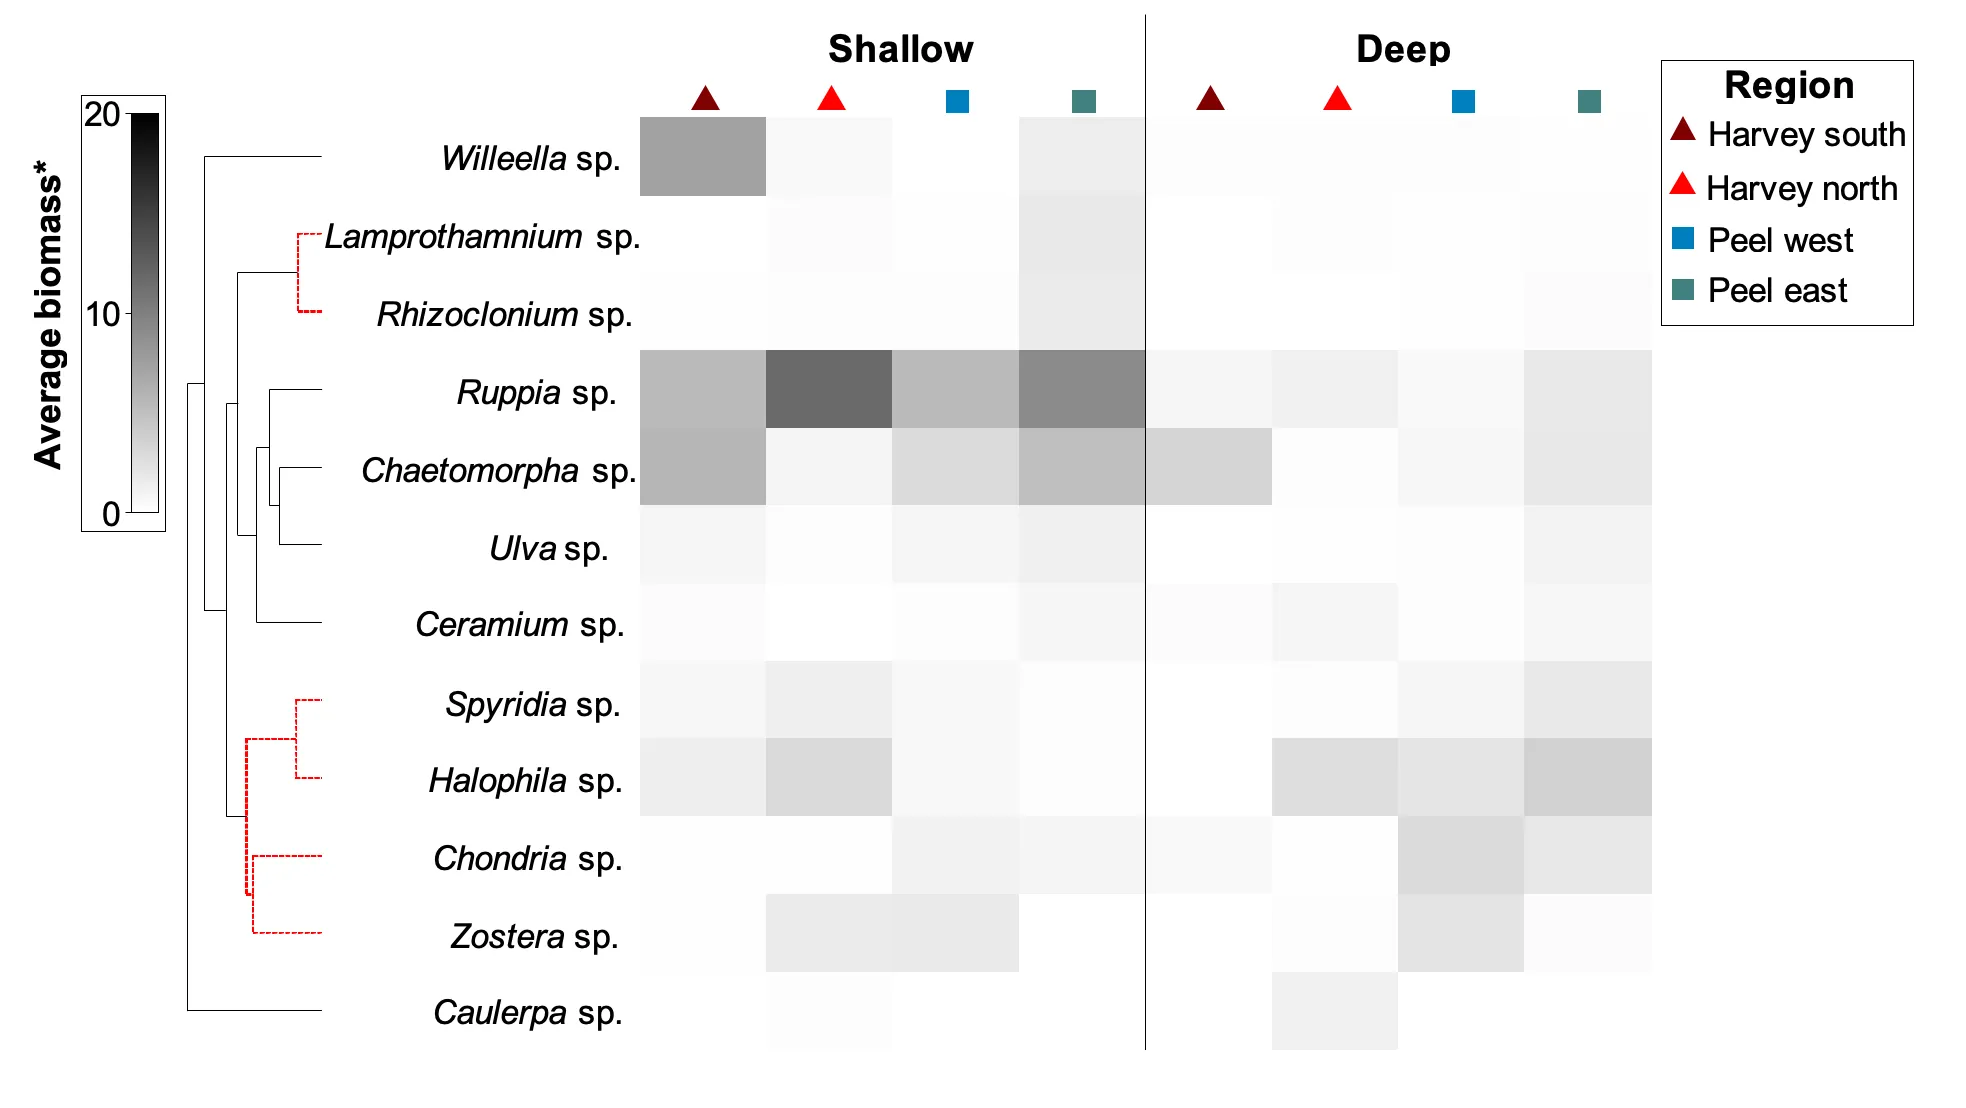
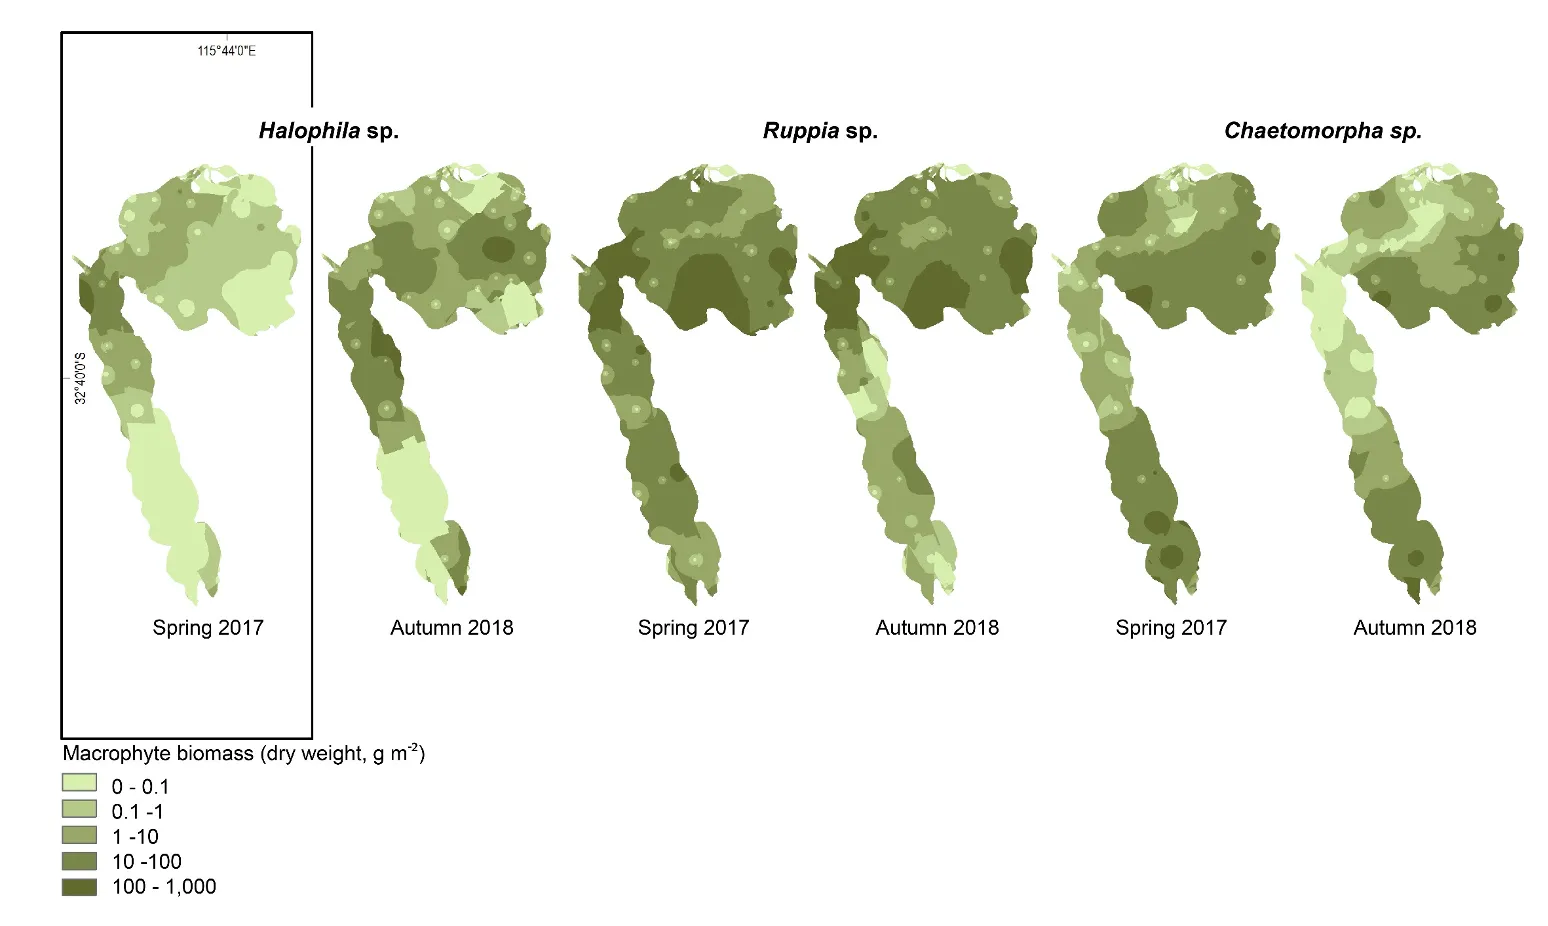
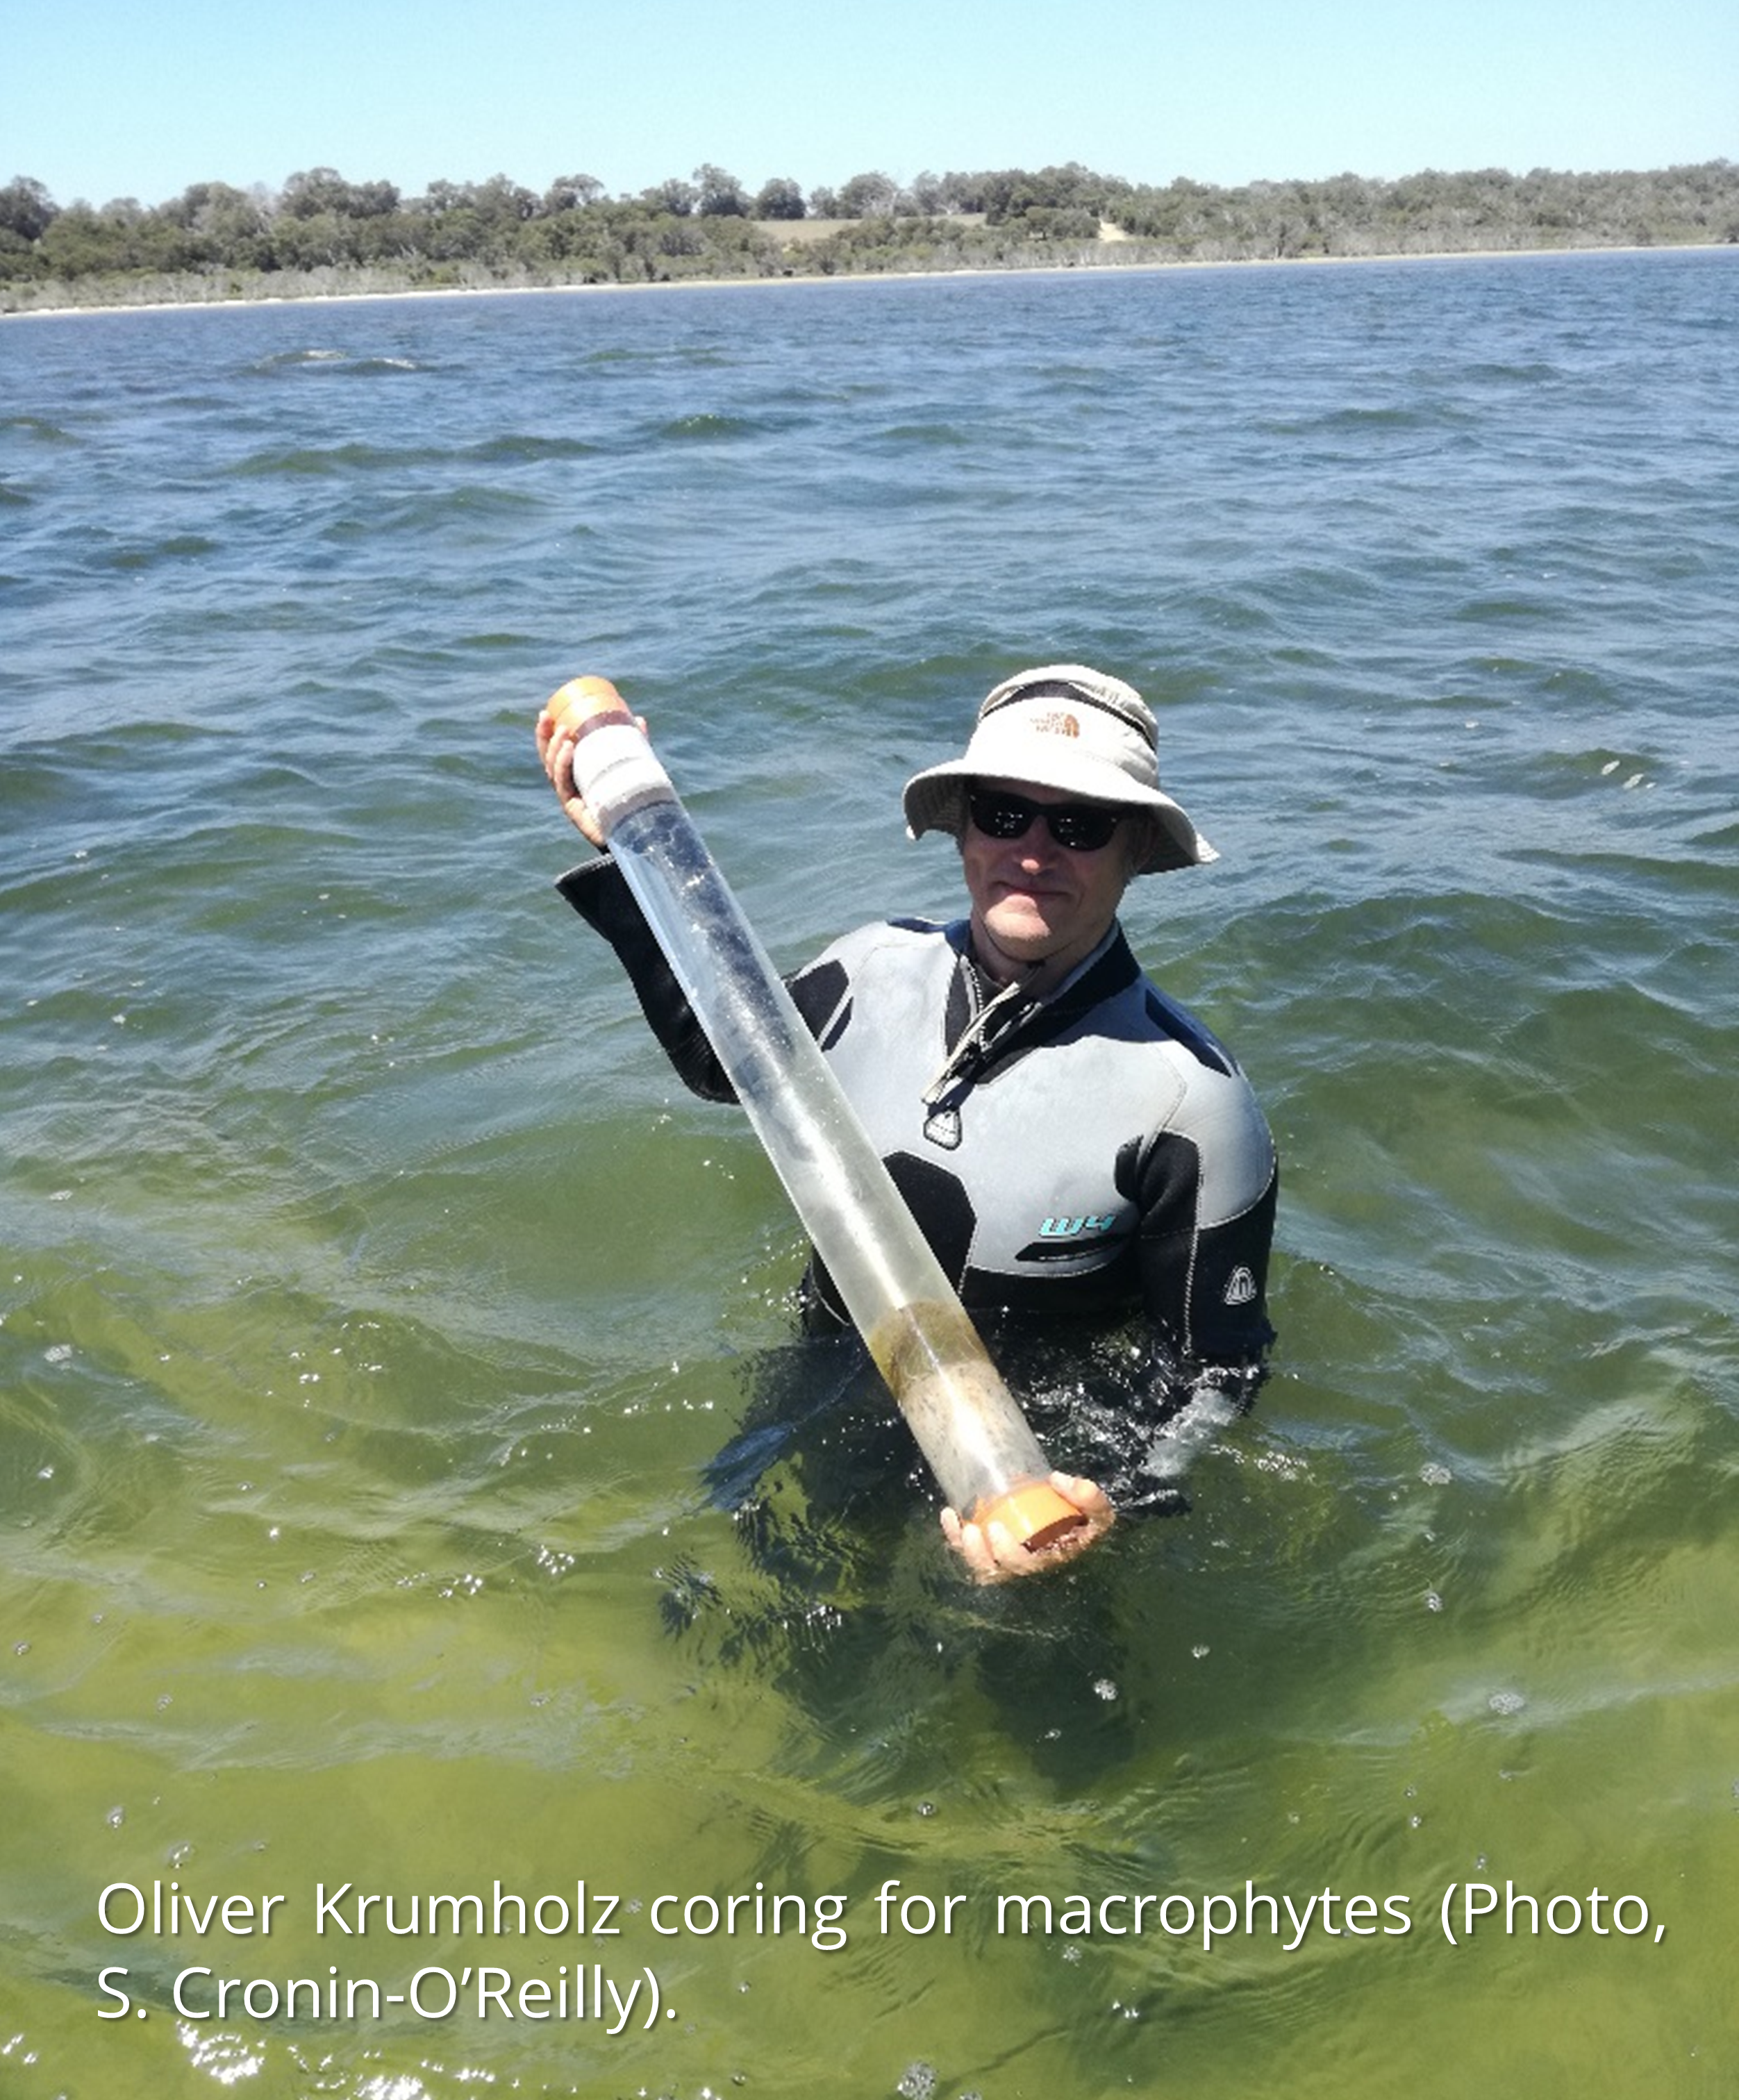
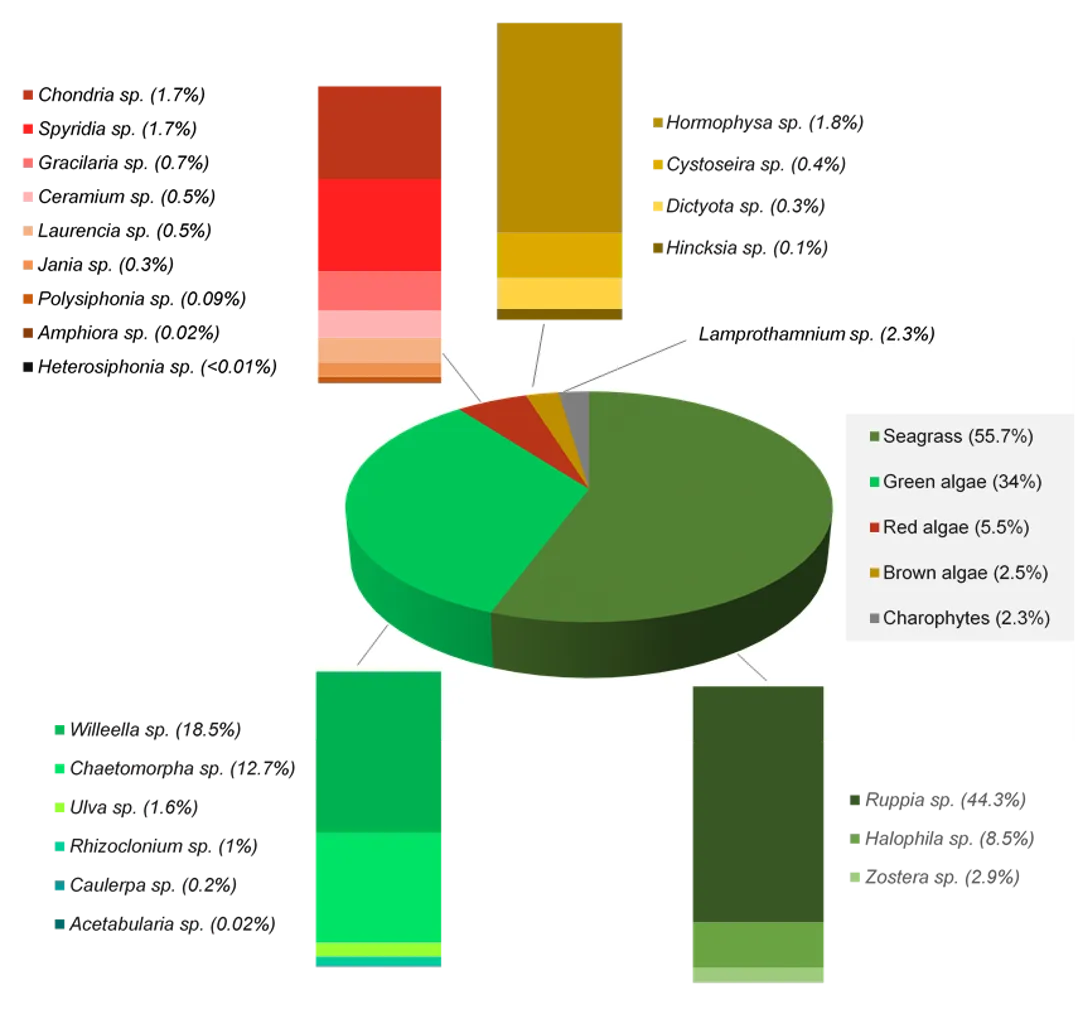
A more detailed study of the macrophytes across the estuary in spring 2017 and autumn 2018 found 23 species in total (over a third of which were red macroalgae), which has increased from the last comparable survey in 2009 (14 species in spring 2009 vs 18 species in spring 2017). Based on biomass, seagrass clearly dominates the 2017–2018 community (56% on average), most of which is Ruppia sp. and occurs mainly in the northern Harvey Estuary and parts of Peel Inlet. Not only has the seagrass contribution increased since spring 2009 (38% vs 60% in spring 2017), but the dominant seagrass species has changed from Zostera sp. to Ruppia sp. As for the long-term macrophyte data, the changes in the 2017–2018 community from more seagrass-dominated assemblages in the northern half of the system to a more green algal-dominated one in the southern Harvey Estuary, were best linked with an increase in total nitrogen, and to a lesser extent total phosphorus.
To better assess the ongoing health and environmental drivers of this macrophyte community, and if its recent move towards seagrass domination reflects a stable shift, it is imperative that a consistent and regular macrophyte monitoring program is implemented, alongside other environmental monitoring of the estuary. The broad monitoring regime we have proposed can be tailored to suit resourcing.
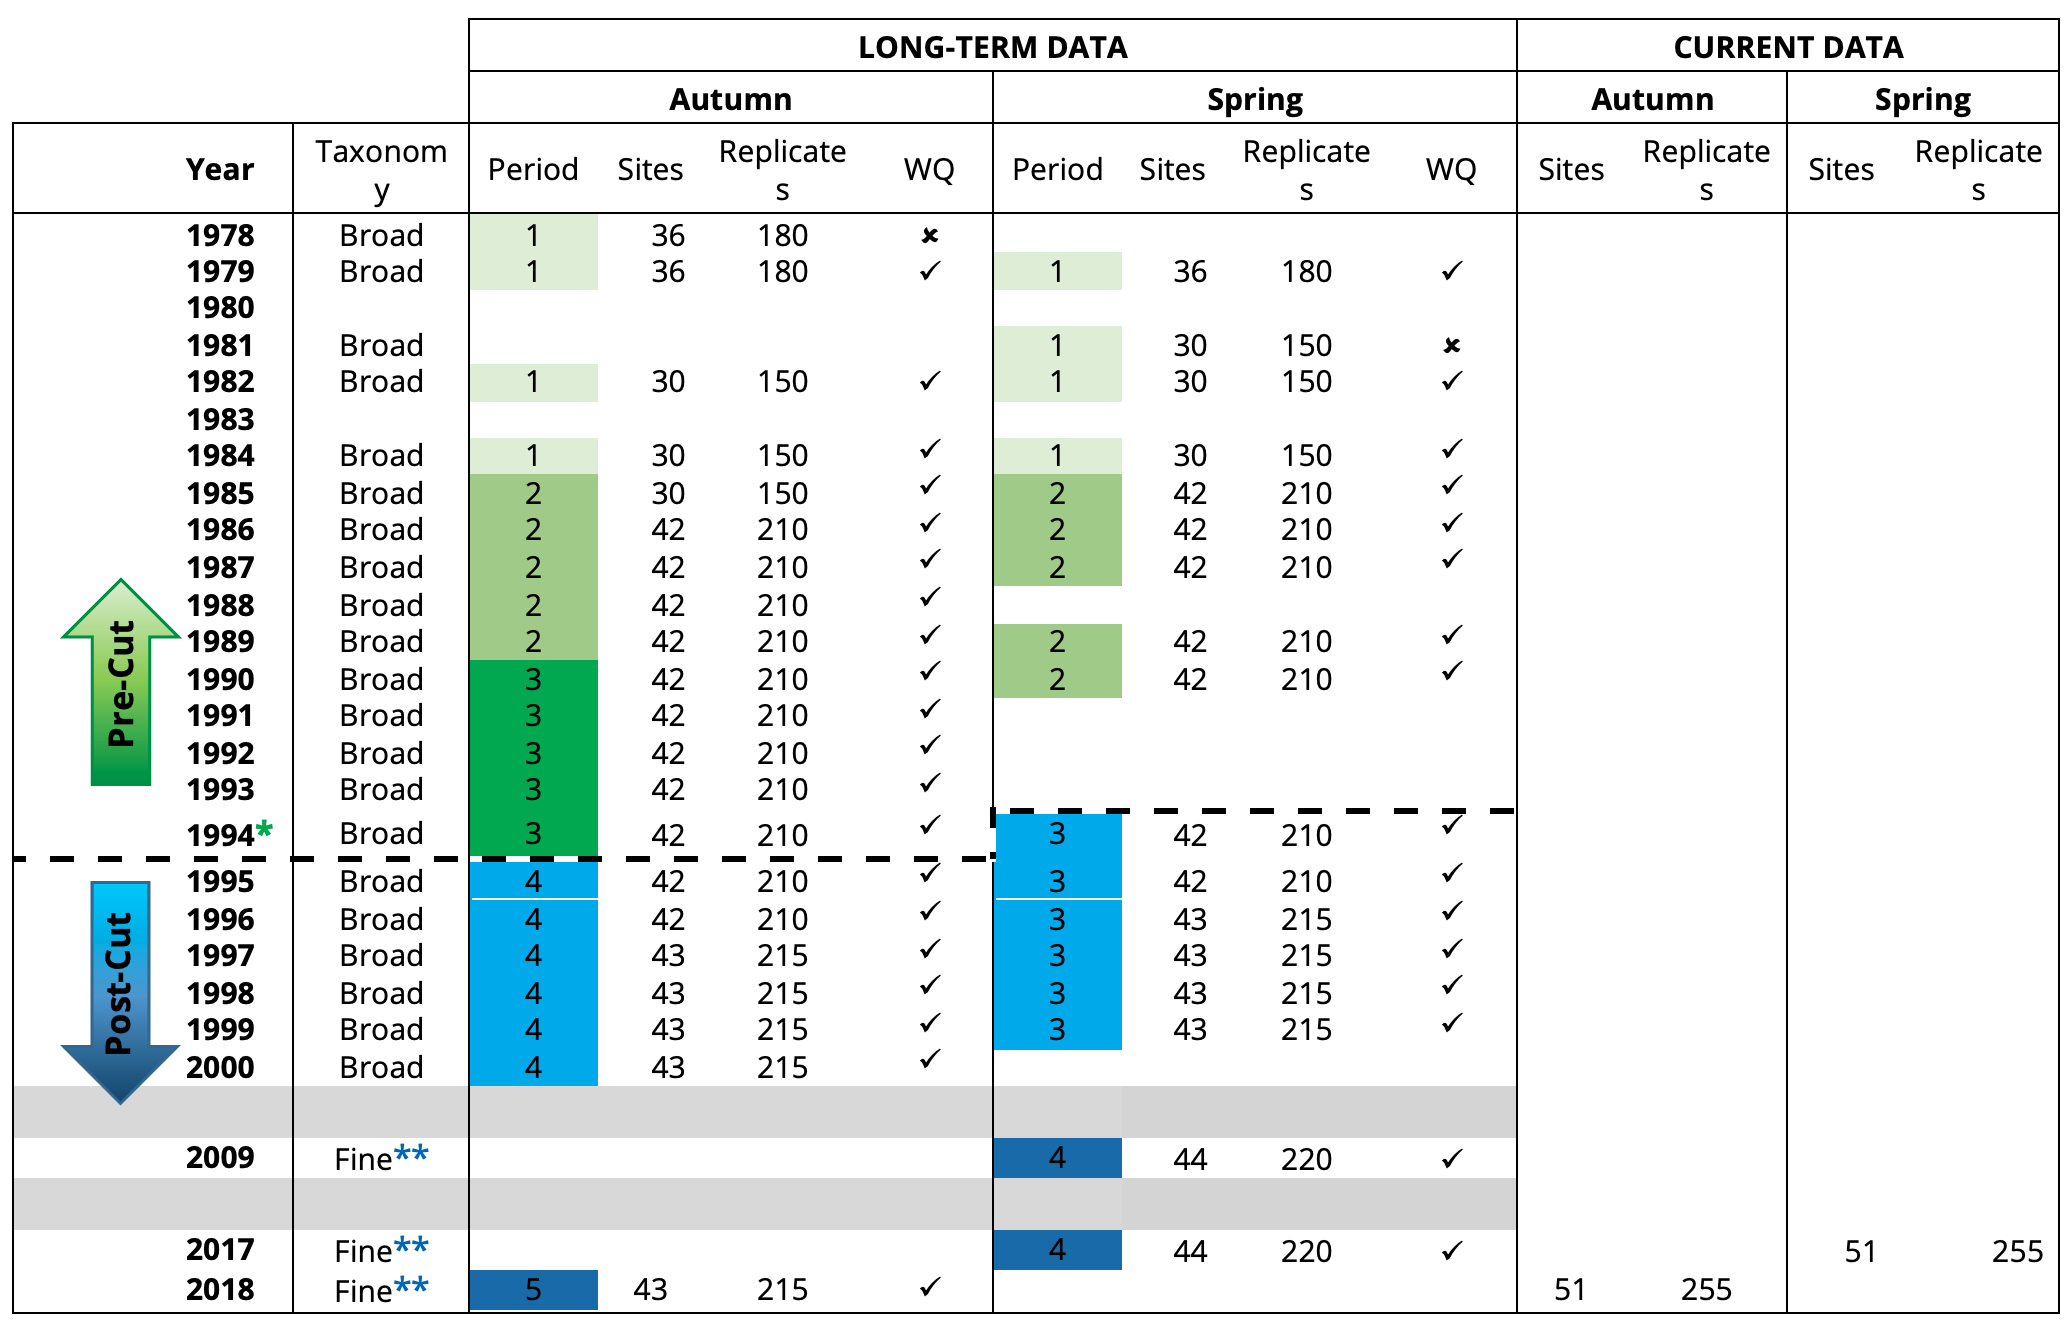
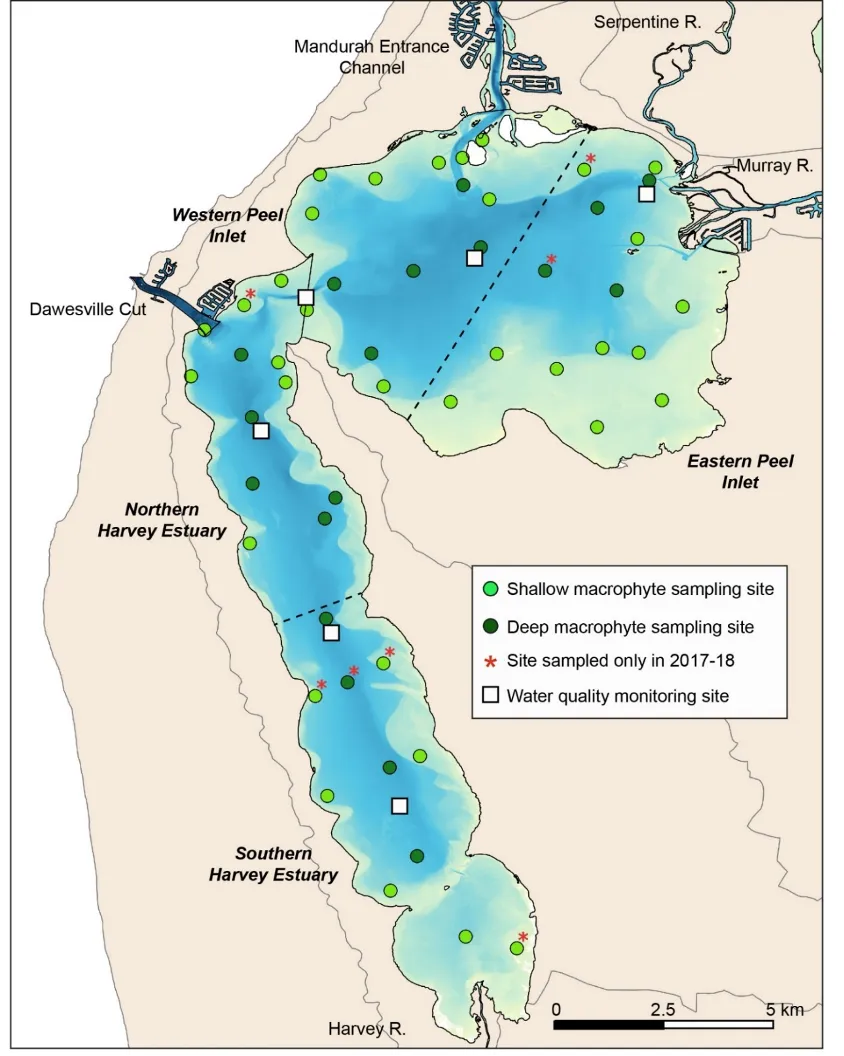
 In addition to the long-term macrophyte dataset, complementary data on various water quality parameters known to influence macrophyte growth (see below) were also collated from the weekly to monthly measurements made at six routine water monitoring sites throughout the estuary since 1977 by the Department of Water and Environmental Regulation (DWER) and other agencies such as MAFRL (see Fig.
 The dominance of seagrass in the current macrophyte community has developed only in the last decade. The survey by