Evaluating the Rapid Assessment Protocol for sediment condition
The RAP is an accurate and cost-effective measure of sediment enrichment and its broader effects on sediment condition
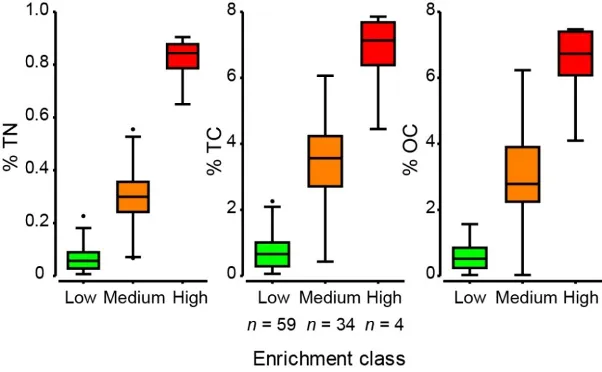
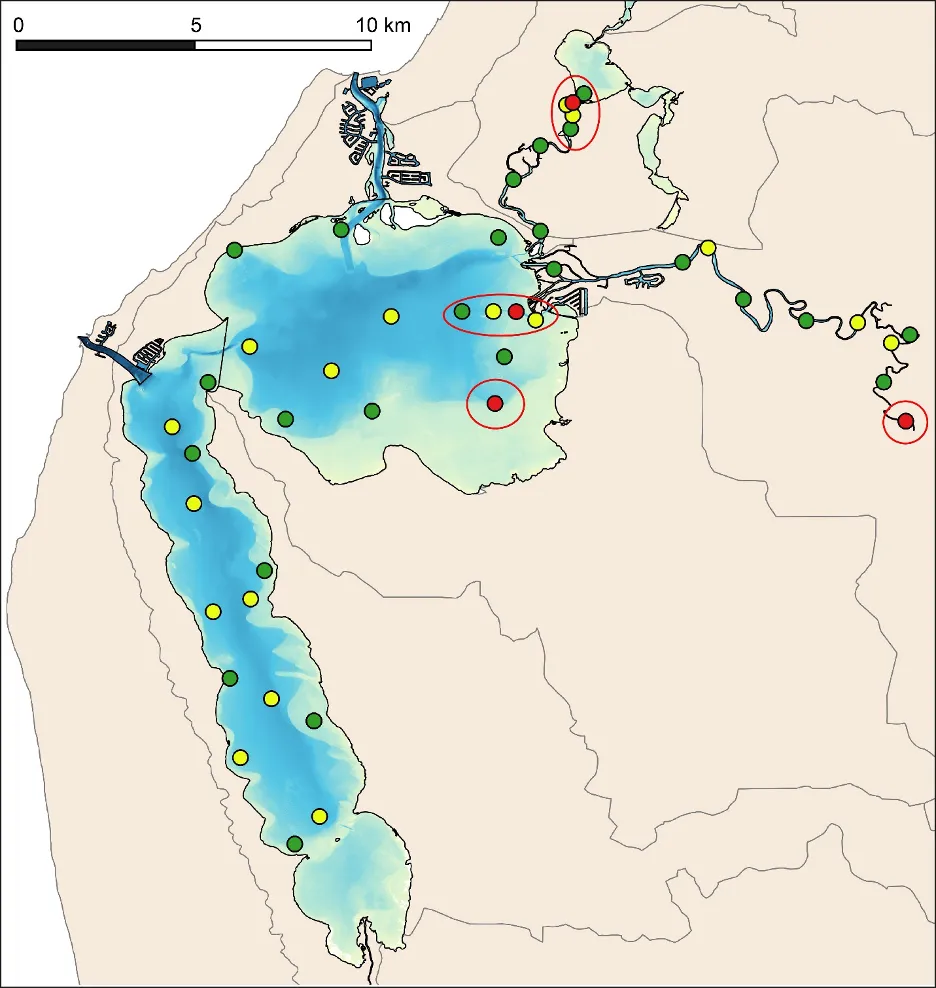
Sites throughout the estuary differed widely in their sediment enrichment (organic matter and nutrients) and mud contents. Sediment TC, most of which comprised OC (a proxy for organic matter), ranged from 0.07-7.85%, whilst TN ranged from 0.01-0.90%. The mud content of sediments ranged from 1-86%, with a mean of ~29%. Statistical clustering of these enrichment measurements at the 97 sites surveyed (see Hallett et al., 2019b) resulted in three, highly distinct groups of sites representing Low enrichment (59 sites), Medium enrichment (34 sites) and High enrichment (4 sites) classes. Sites in the High enrichment class had enrichment levels 10–15 times higher than those of the Low class (based on median values for TN, TC and OC; Fig. 6.3).
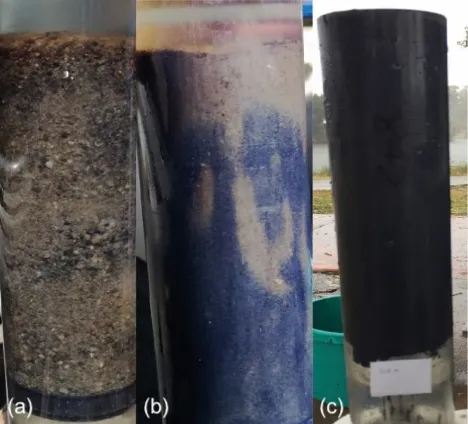
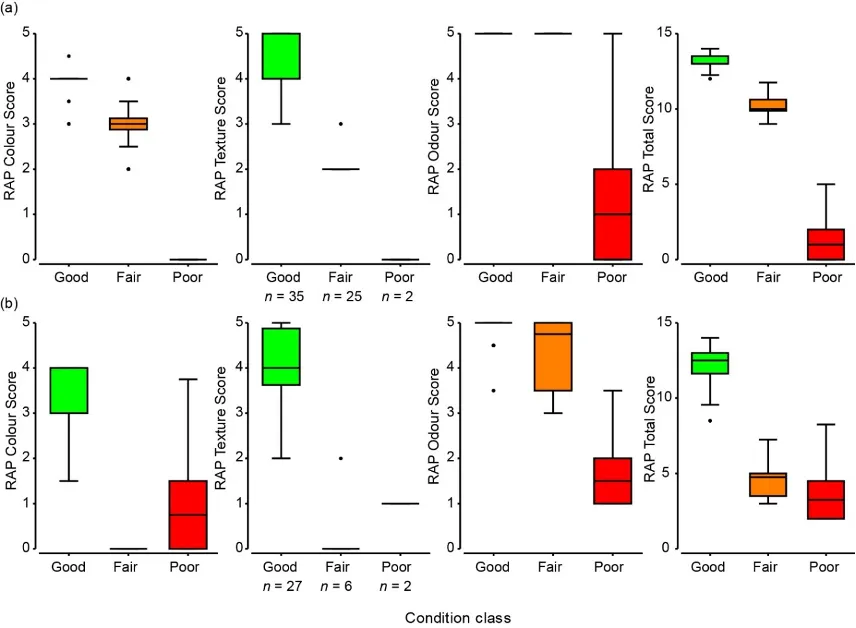
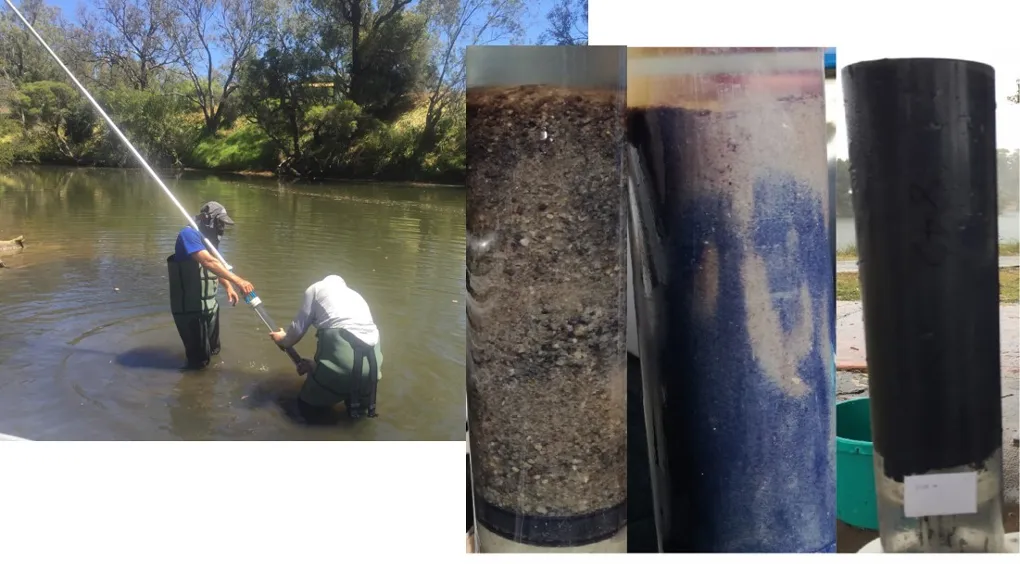
With respect to the sediment attributes that were scored using the RAP, very clear differences in colour, texture and odour were observed among sites (Fig. 6.4). Based on their scores across these three attributes, 35, 25 and two sites of the 62 surveyed across the basins were classed as in Good, Fair and Poor condition, respectively. Among riverine sites, 27 were in Good condition, six were Fair and two were Poor. The patterns in RAP scores among these condition classes differed slightly between basin and river sites. In the basins, colour and texture scores declined consistently from Good (median scores of 4) to Poor (median scores of 0), as did total RAP scores (Fig. 6.4a). In contrast, riverine sites in Fair and Poor condition showed similarly low colour and texture scores (median ≤1) and total RAP scores (Fig. 6.4b). Low odour scores were largely restricted to basin and river sites in Poor condition (medians of 1.5 and 1, respectively).
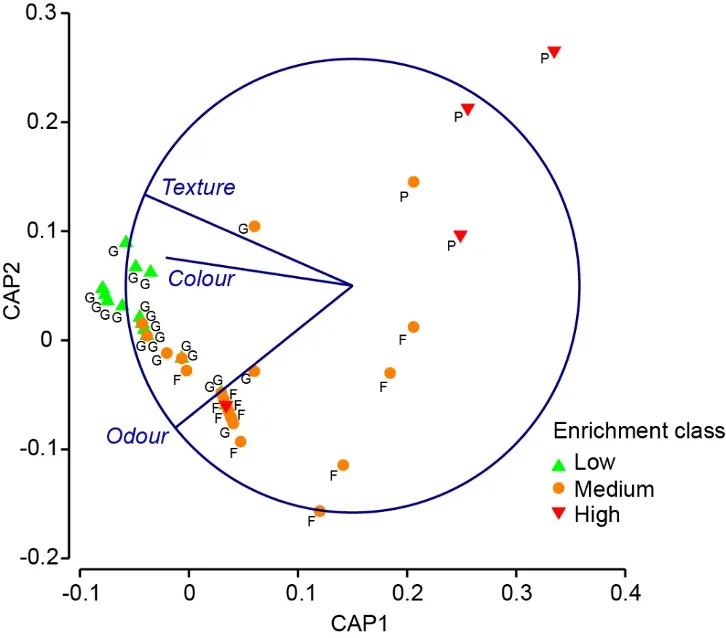
The RAP was shown to provide a highly useful proxy for assessing the degree of sediment enrichment and its broader effects on sediment condition throughout the estuary. A summary of the statistical method used to test this relationship is shown in Fig. 6.6, with the key outcomes of the test (known as ‘Canonical Analysis of Principal Coordinates’, or CAP) as follows. A guide for interpreting the CAP plot is given below, and further details are in Hallett et al. (2019b).
There was a strong association between the RAP scores of sediment condition and the quantitative enrichment classes (low, medium and high), i.e. correlations of 0.62–0.78.
Sites grading from low through to high enrichment were best explained by differences in sediment texture (grading from grainy sands to oozy muds) and colour (grading from yellow/brown to black), with high enrichment sites also being particularly linked with strong odours.
RAP scores differed significantly among the enrichment classes, and correctly identified the right enrichment class for sites ~84% of the time. The RAP was particularly successful (<12% misclassification rate) at identifying sites with low enrichment, demonstrating its promise as a first-pass survey approach for identifying ‘least impacted’ reference or control sites to support future impact assessments.
Broadly, to interpret the CAP plot in Fig. 6.6: (1) the points on the plot represent the survey sites, which are each colour-coded by their enrichment class (low, medium and high) and labelled with their condition class (black labels; good, fair and poor) – simply, sites lying close together on the plot have more similar condition and enrichment characteristics than those further apart; (2) site differences in sediment condition and enrichment were well ‘explained’ by two main gradients – the horizontal axis (CAP1) and vertical axis (CAP2). The blue lines (vectors) overlaid on the plot show the roles played by each of the RAP characteristics in helping to explain those site differences. Thus, sites grading from low to high enrichment (and good to poor condition) from left to right along CAP1 were associated strongly with decreasing RAP scores for sediment texture and colour (i.e. vector lines lying mainly parallel to CAP1) and to a lesser extent odour (vector line at a sharper angle to CAP1). Moving from the bottom to the top along CAP2, the greatest separation of sites was seen for those in the high enrichment class. The RAP vector most strongly linked with this separation was odour, reflecting stronger smelling sediments in the high enrichment class.
The RAP can predict the sediment condition of any new site
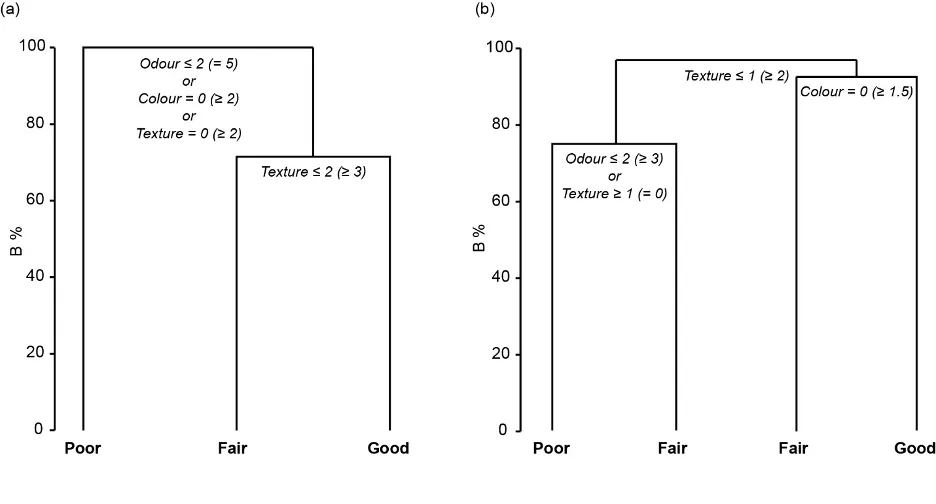
Given the above validation that the RAP accurately reflects sediment enrichment and broader sediment condition, easy-to-use decision trees were then generated to enable any investigator to reliably predict the sediment condition class of any further basin or river site in the Peel-Harvey based solely on its observed RAP scores. These decision trees (produced statistically by a regression tree approach, see Hallett et al., 2019b) are shown in Fig. 6.7 below. To use these trees, the RAP scores of any new sediment sample are simply compared to the thresholds at each branch of the tree, starting at the top, then taking a left path if the non-bracketed criteria are true, or a right path if the bracketed criteria are true.
The decision tree for basin sites indicated that Poor sediment condition would be predicted for any future site with odour scores of ≤2 (i.e. moderate to strong smell of hydrogen sulphide, or ‘rotten egg gas’; Table 6.1), or colour or texture scores of 0 (black oozy muds; Table 6.1, Fig. 6.7a). Separation of basin sites with Fair or Good sediment condition mainly depends on whether their texture score was ≤2 or ≥3, respectively (i.e. smooth to oozy muds vs. grainy sands). Among river sites, Good sediment condition would be predicted for those with texture scores of ≥2 and colour scores of ≥1.5, and Poor condition for sites with odour scores of ≤2 or texture scores of <1 (Fig. 6.7b).
These decision rules were used to determine the condition of sediments at a further 120 sites throughout the Peel-Harvey in 2017–18, to help quantify the ecological responses of benthic macroinvertebrate communities to sediment stressors and subsequently establish a new biological index of estuarine condition (Chapter 8). Given the speed and low resource costs of applying the RAP decision rules, they could clearly provide a robust, consistent and cost-effective approach for future monitoring of sediment condition throughout the Peel-Harvey.
Sediments in the deeper parts of the Harvey Estuary are generally muddier, more enriched and in poorer condition than those in the Peel Inlet
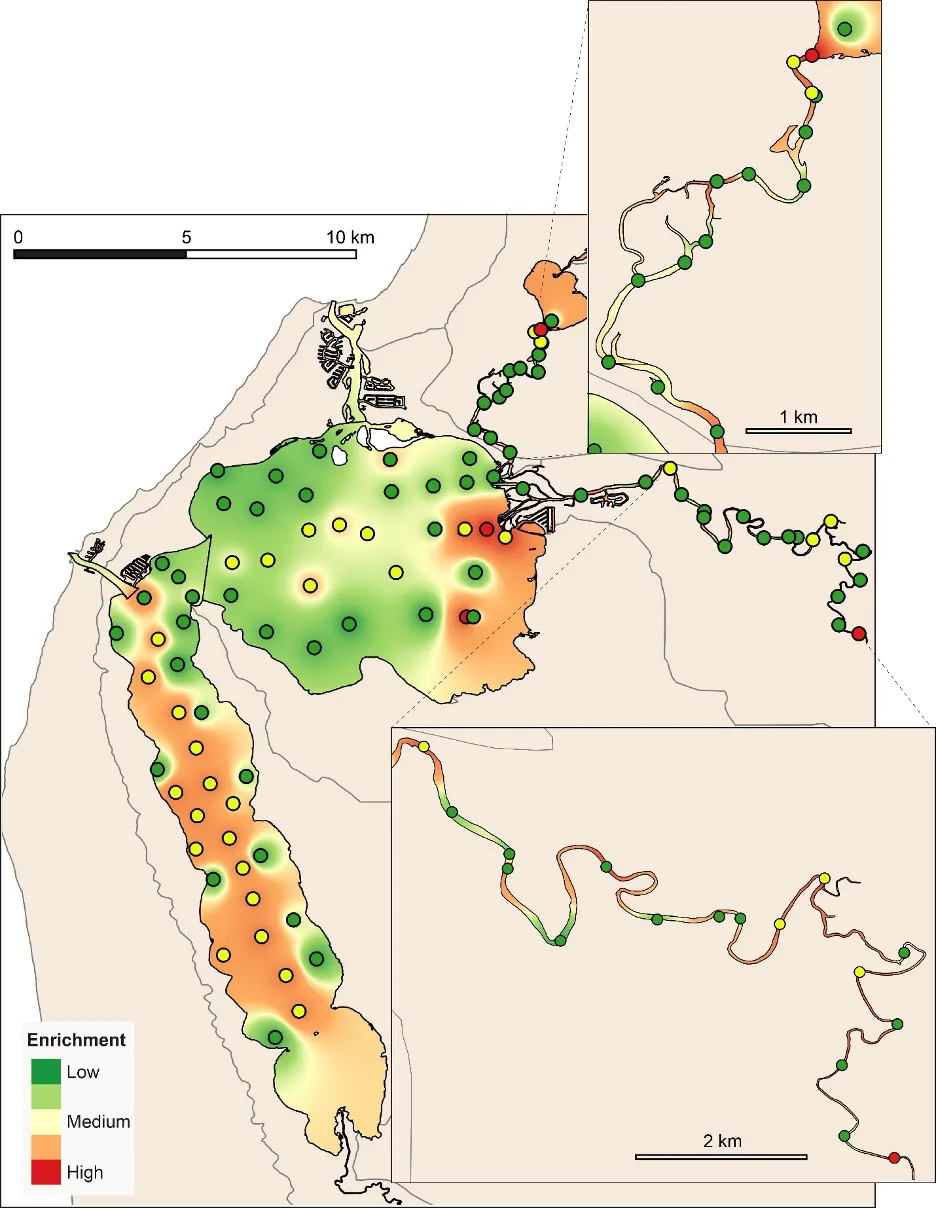
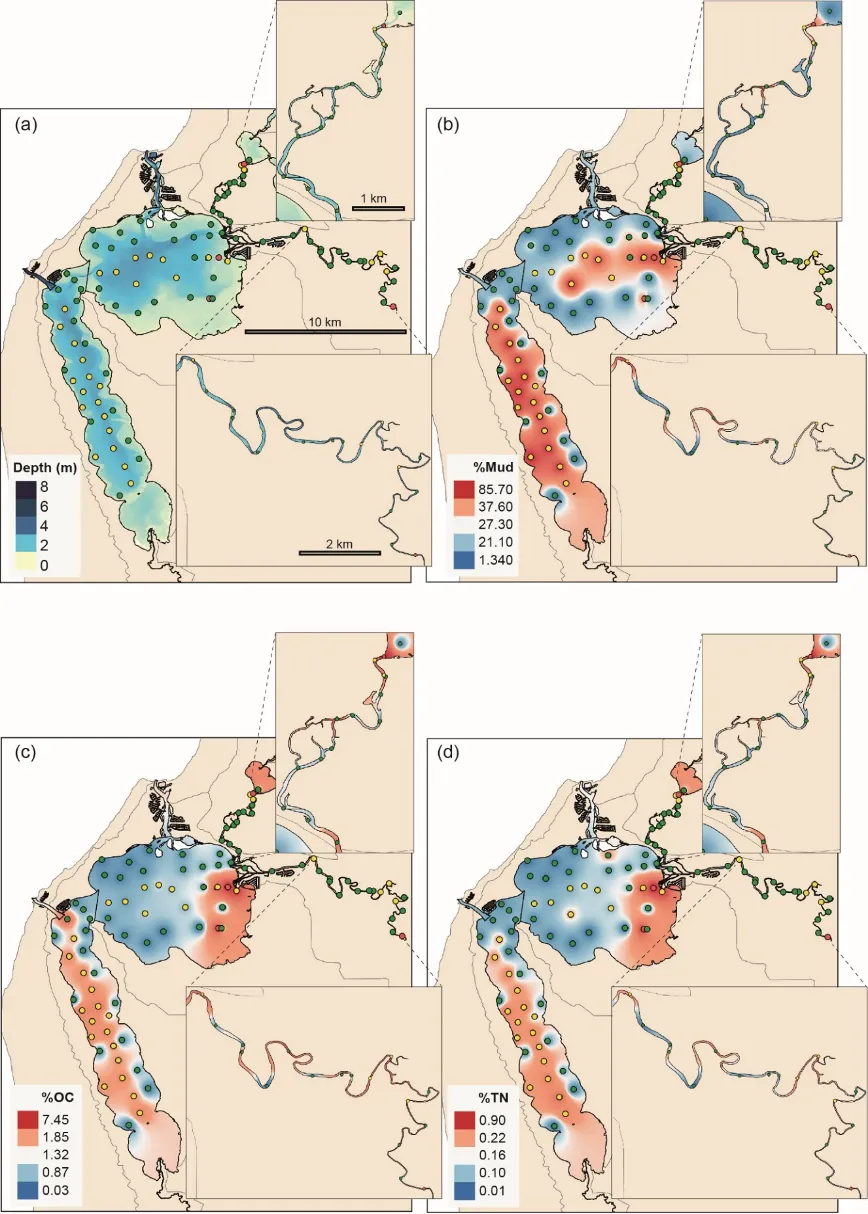
In general, the least enriched sediments were located around the edges of the estuary basins, and particularly in the well-flushed western Peel Inlet and northern-most Harvey Estuary, whereas the more central parts of the basins tended to be more enriched (Fig. 6.8). Harvey Estuary sediments were notably more enriched than those in Peel Inlet, although the south-eastern corner of Peel Inlet was also a hotspot of enrichment. Much of the sediment in the rivers was moderately to highly enriched, with the highest levels typically seen among sites further upstream. These patterns in enrichment were generally mirrored by those in sediment condition, with more enriched sites often exhibiting poorer condition.
Spatial interpolations of water depth, sediment mud content and enrichment parameters help to illuminate the effects of both natural and human influences on patterns in sediment condition throughout the estuary. Deeper, central parts of the estuary basins generally exhibited Fair sediment condition, in contrast to the Good condition of many sites on the shallower margins (Fig. 6.9a). This generally reflected higher mud contents at the deeper basin sites, but particularly at those in the Harvey Estuary (>60% mud; Fig. 6.9b), where levels of enrichment were notably higher (Fig. 6.9c, d). These patterns were confirmed by statistical tests (distance-based linear modelling), which revealed that enrichment alone explained the largest proportion of the variability in RAP scores (57% among basin sites and 52% among river sites; Supplementary Materials S6.1). Enrichment was significantly associated with poorer sediment condition among river and basin sites, irrespective of their mud content. Nonetheless, enriched sediments were particularly likely to exhibit poorer condition if they were also muddier, which in the case of basin sites was associated with greater water depths.
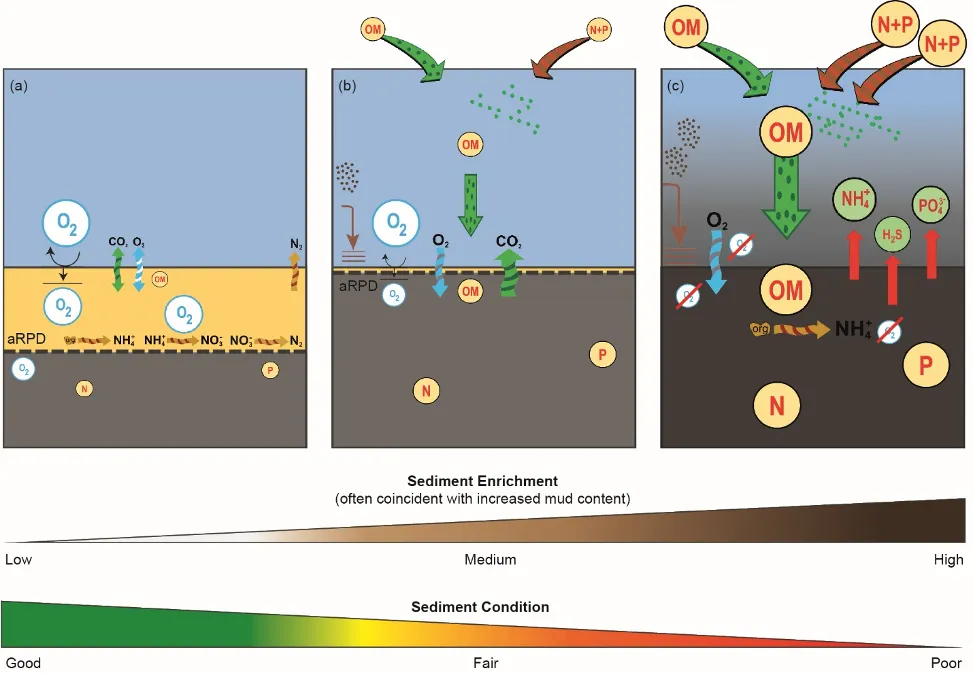
These relationships reflect the clear effects of enrichment, and associated muddying, on the physical and biogeochemical characteristics, and therefore condition, of sediments. Accumulation of OM and nutrients, often in conjunction with increased fine particles (mud), alters the physical and biogeochemical properties of sediments, including their porosity, oxygenation status and nutrient cycling processes (Fig. 6.1; Eyre and Ferguson (2009) Valdemarsen et al. (2010)). These changes manifest as changes in sediment texture, colour and odour (Hargrave et al., 2008; Rosenberg et al., 2001), which the RAP summarises via a semi-quantitative scoring system.
The proportion of mud, which varies naturally with water depth, influences sediment enrichment as nutrients and OM bind to fine sediment particles. Deeper waters tend to harbour muddier and therefore more enriched sediments, which impacts their sediment condition. This is particularly true in the Peel-Harvey, which experiences naturally low levels of tidal flushing due to the estuary’s narrow connections to the microtidal marine environment, and also declining freshwater flows under a drying climate which are reducing the degree of riverine flushing and leading to increased stratification and retention (Hallett et al., 2018; Valesini et al., 2019). The finding of muddier, enriched sediments in the deeper waters of the Harvey Estuary matches patterns observed during historical sediment surveys in 1978–89 (McComb et al., 1998). The intensively fertilized Harvey catchment, with its particularly high density of artificial drains and sandy sediments with low nutrient binding capacity, has delivered large quantities of inorganic nutrients to the estuary over many decades (McComb and Humphries, 1992). Also, significant freshwater flows from the upper Harvey River have been artificially diverted to the ocean since the 1930s, contributing to the Harvey Estuary experiencing far less flushing than the Peel Inlet, which receives flows from the Serpentine and much larger Murray rivers. As a result, fine sediments, nutrients and OM from the Harvey catchment have tended to accumulate in its basin to a greater degree, with evident impacts on sediment enrichment and condition. This outcome has potentially important implications for the future management of water resources and downstream impacts in the Harvey Estuary, particularly under a drying climate that will see further reductions in flushing river flows (Hallett et al., 2018).
The poorest sediment condition was observed in navigation channels and other areas of high deposition, including upper parts of the Serpentine and Murray rivers
The poorest sediment condition in the Peel-Harvey Estuary occurred at highly depositional sites characterised by both high enrichment and mud content. These included the upper Serpentine and Murray rivers, the southeast corner of the Peel Inlet and the artificially deepened Yunderup Channel (Figs 6.8, 6.9). Flushing is minimal in the latter locations and thick macroalgal mats are known to accumulate and rapidly become buried below layers of fine sediment (Morgan et al., 2012). Previously, intensive studies of these channel sites have revealed strongly reducing (i.e. anoxic), monosulfidic sediments that can release ammonium and phosphates into the water column (Kraal et al., 2013b). These findings have significant implications given the forecast expansion of coastal developments in the area such as residential living, marina developments, and supporting boating channels.
The RAP could be employed for spatially extensive, yet rapid and cost-effective surveys of navigation channels and other highly depositional areas throughout the estuary, to quantify the extent of these highly degraded sediments and help better inform future dredging activities.
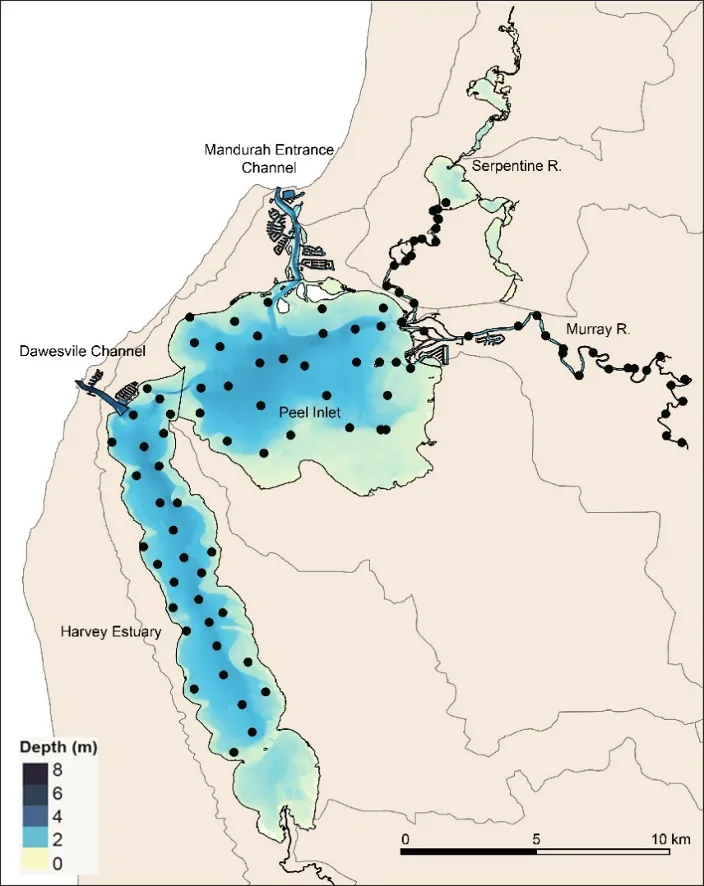
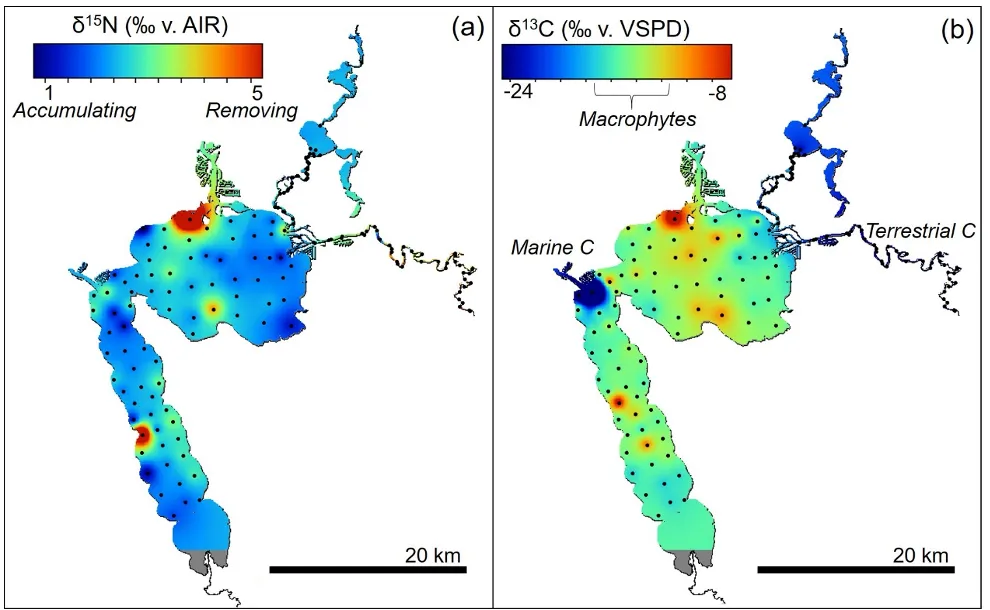
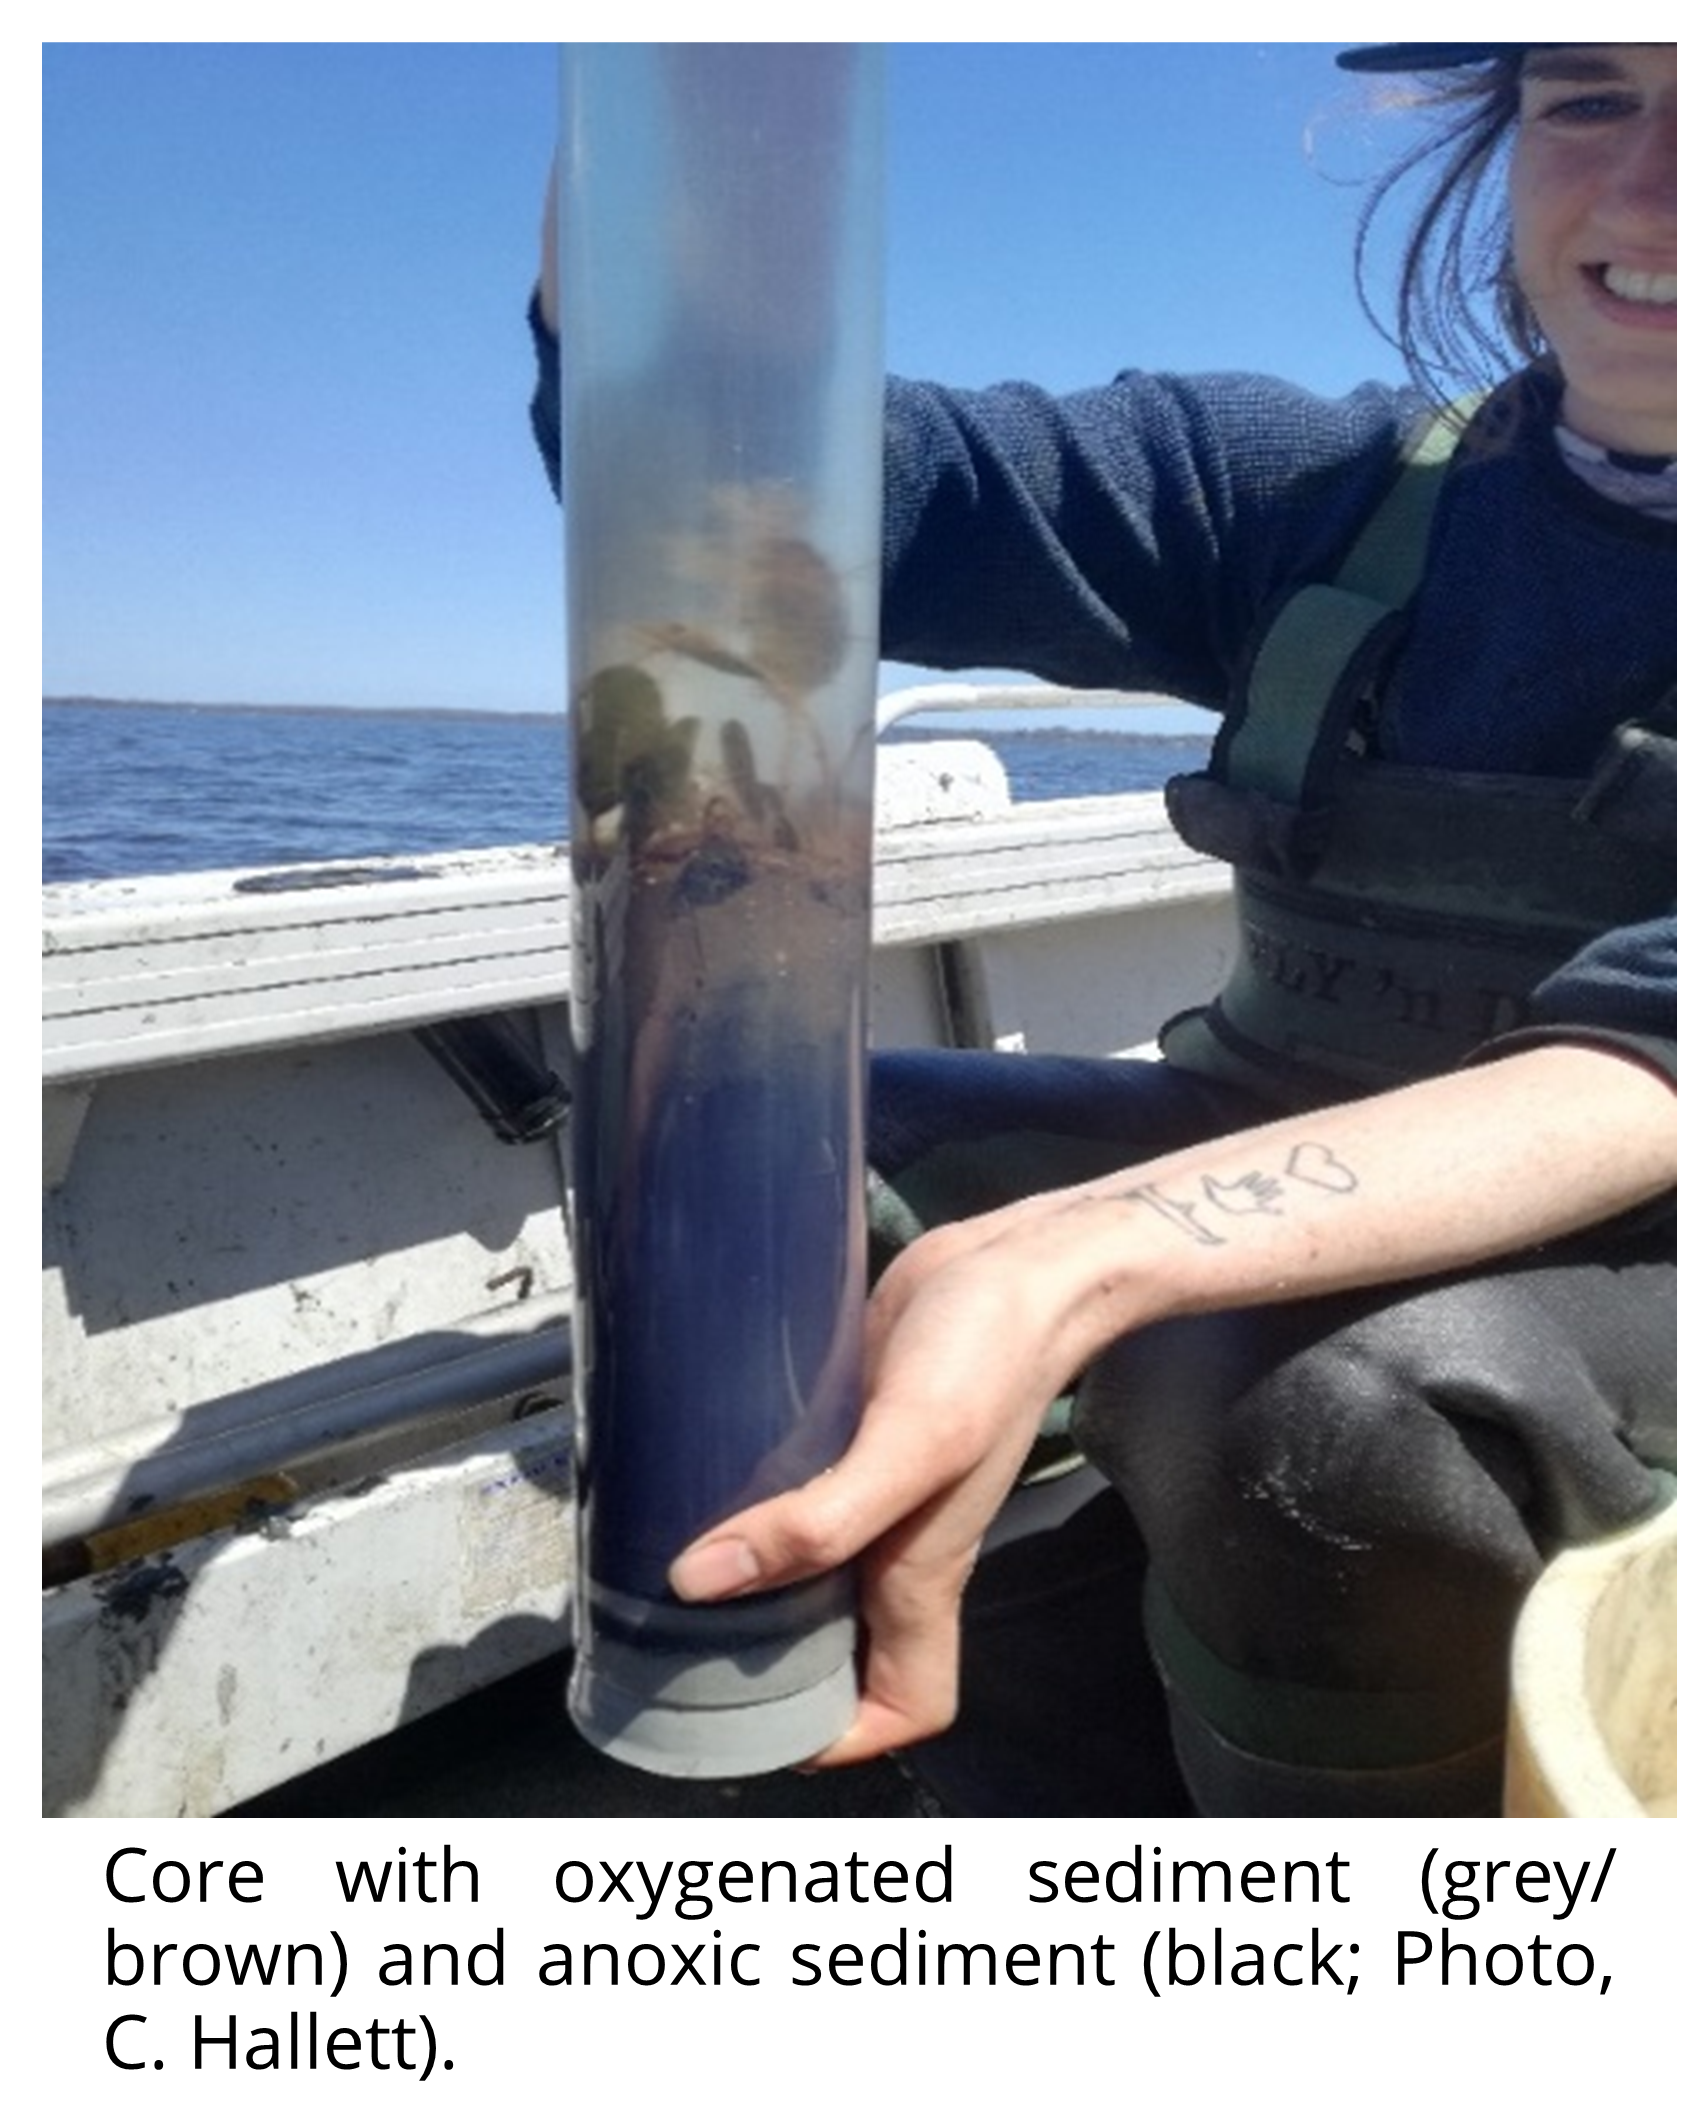 We undertook a broad-scale survey of sediments at almost 100 sites throughout the estuary basins and rivers in November-December 2016. We collected (i) scored data on sediment colour, texture and odour; (ii) quantitative measurements of sediment enrichment (total carbon, TC; organic carbon, OC; total nitrogen, TN) and grain size, and (iii) C and N isotopes, to better understand how human activities may have impacted the estuary via chronic or acute enrichment. This sediment data also provided key ‘base layers’ for the estuary biogeochemical model (Chapter