Modelling Quokkas in R
Setting up
Declare the constants as variables
birthRate  <- 1
deathRate  <- 0.1
timestep  <- 1 # i.e. 1 year
timeMax <- 30
carryCap  <- 10000
Create a new data frame of the initial values
- A data frame is simply a table
year,relativeCarryCap,quokkaRate, andquokkaRatewill be created as new columns in that table- Inspect
modelwith thehead()function
model  <- data.frame(
    year = 1,
    relativeCarryCap  = NA,
    quokkaRate = NA,
    quokkaPop = 5
)

head(model)
## year relativeCarryCap quokkaRate quokkaPop
## 1 1 NA NA 5Modelling
Calculate the next timestep
For the next time step we’ll need to compute new values for year, relativeCarryCap, quokkaRate, and quokkaPop. These values will be appended as a new row (i.e. timestep) to the model data frame.
yeartakes a value of 2
year <- 2relativeCarryCapis the result of the previous quokka population divided by the carrying capacitymodel$quokkaPop[1]specifies the population in the previous row (row 1) i.e. the previous time step
relativeCarryCap <- model$quokkaPop[1]/carryCapquokkaRateandquokkaPopare calculated in the same fashion i.e. using the constants and values in the previous row of themodeldata frame
quokkaRate <- timestep*((1-relativeCarryCap)*birthRate*model$quokkaPop[1]-(deathRate*model$quokkaPop[1]))

quokkaPop <- quokkaRate+model$quokkaPop[1]- Next, we’ll create an identical data frame to
modelwith our new values
model_temp  <- data.frame(
        year = year,
        relativeCarryCap = relativeCarryCap,
        quokkaRate = quokkaRate,
        quokkaPop = quokkaPop
    )

head(model_temp)
## year relativeCarryCap quokkaRate quokkaPop
## 1 2 5e-04 4.4975 9.4975- We can append this time step to
modelby using therbind()function
model  <- rbind(model,model_temp)
head(model)
## year relativeCarryCap quokkaRate quokkaPop
## 1 1 NA NA 5.0000
## 2 2 5e-04 4.4975 9.4975Speeding things up
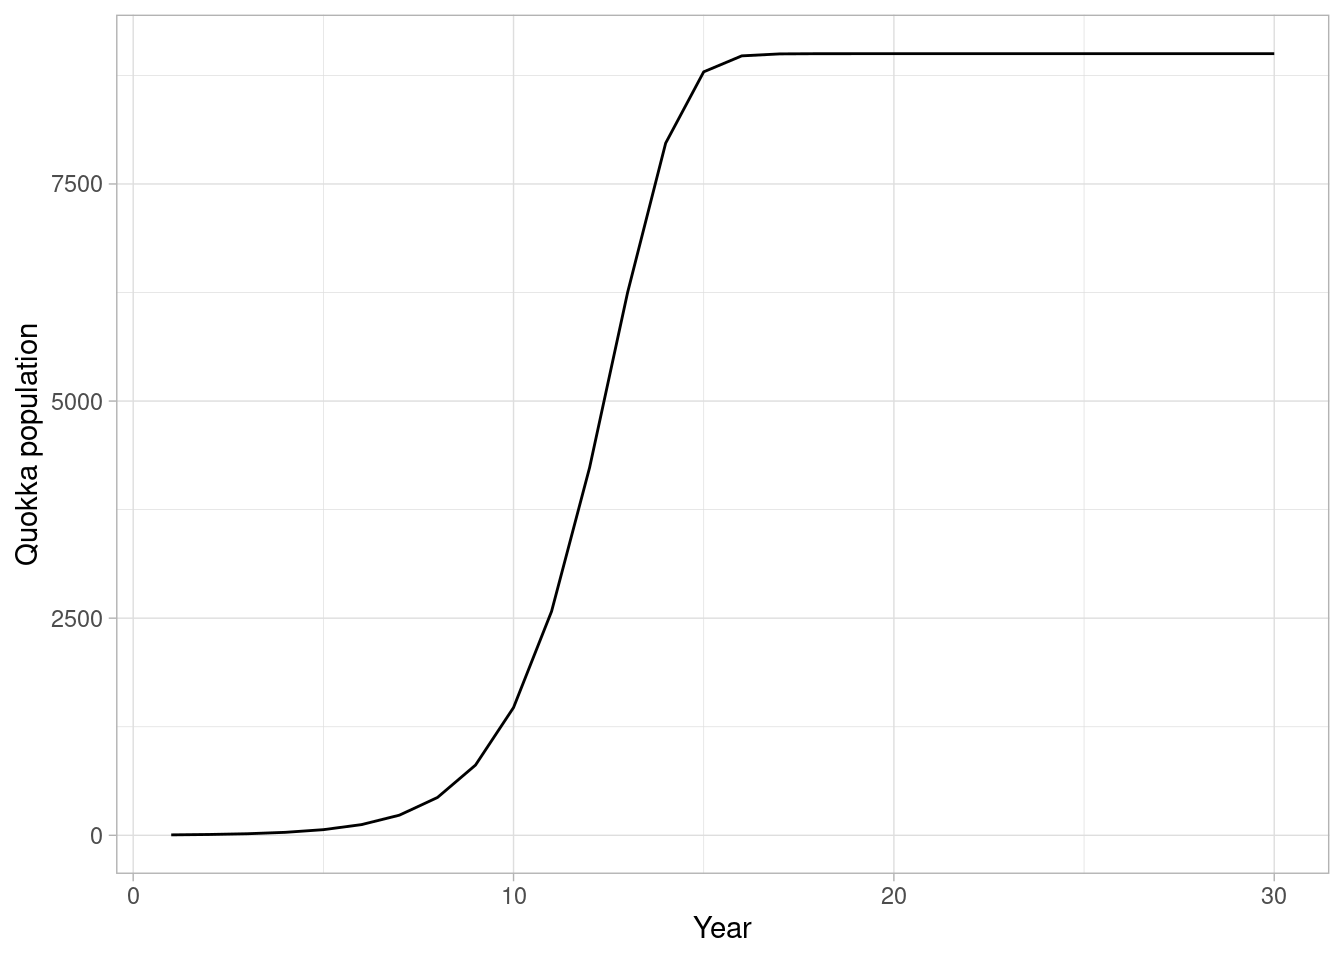
Want to repeat that process for the next 29 time steps? Probably not. Let’s create a loop that iterates through each year, calculates the new values, and appends them to the model data frame.
for(i in 2:timeMax){

    year  <- i
    relativeCarryCap  <-  model$quokkaPop[i-1]/carryCap
    quokkaRate = timestep*((1-relativeCarryCap)*birthRate*model$quokkaPop[i-1]-(deathRate*model$quokkaPop[i-1]))
    quokkaPop = quokkaRate+model$quokkaPop[i-1]

    model_temp  <- data.frame(
        year = year,
        relativeCarryCap = relativeCarryCap,
        quokkaRate = quokkaRate,
        quokkaPop = quokkaPop
    )

    model  <- rbind(model,model_temp)

}