17 Benthic Habitat Quality
17.2 Overview
The model simulates “habitat suitability” based on an assessment of environmental conditions relative to the known requirements of the studied species, for example, considering salinity, light, dissolved oxygen and/or other environmental conditions. More specifically, a relative index, Habitat Suitability Index (HSI), is defined based on species tolerance thresholds and calculated to infer spatio-temporal probabilities of habitat suitability. The HSI ranges from 0 to 1, indicating habitat being least suitable to most suitable. For species with distinct requirements for each life-stage (e.g., seed germination, egg incubation), the model assesses environmental conditions against thresholds set for each life-stage. The model outputs HSI for each model cell at each time step based on simulated environmental conditions from the host model. The output can subsequently be processed and assessed in a programming language (e.g., Matlab, R) according to the research question. For example, for studies considering multiple life-stages in the life cycle of a species (e.g., seed germination – vegetative growth – flowering – seed production), model output for each life-stage can be integrated over a biological relevant period based on the typical duration and seasonal timing, into an overall habitat suitability for successful completion of its life cycle.
17.3 Model Description - Ruppia Habitat
The model is originally based on an application to the Coorong Lagoon in South Australia for a keystone seagrass species Ruppia tuberosa. R. tuberosa’s annual life cycle includes several life-stages including both sexual and asexual reproductive pathways, as indicated in Figure 17.1. The identified environmental controls on growth include salinity, temperature, light, water depth and macroalgae presence. Refer to the CDM manual for further details on Ruppia and the Coorong.
The Habitat Suitability Index (HSI) is computed based on suitability of conditions (\(i\)), for each of the main life-stages (\(j\)), by defining a fractional index, \(Φ^{HSIj}_{i}\). The fractional index for each attribute is computed in each model cell (\(c\)) at each time step (\(t\)). The individual functions are piece wise, based on synthesis of available literature and analyses of survey data (Table 17.2). Refer to the CDM manual for details on rationale.
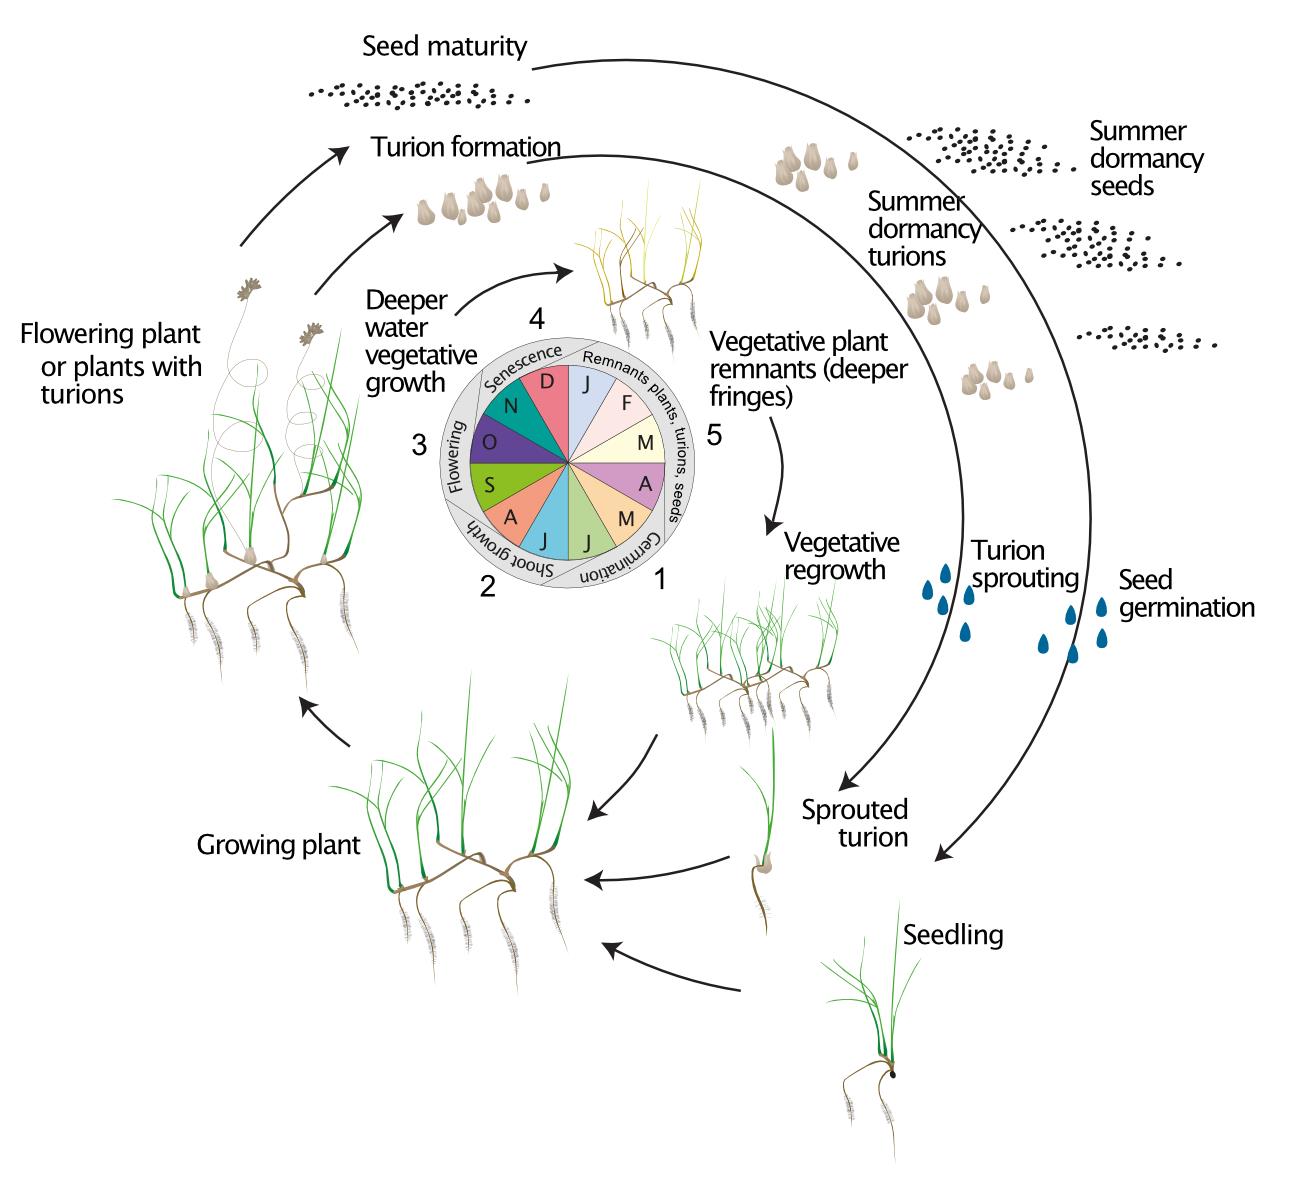
Figure 17.1: Conceptual diagram of the R. tuberosa five-stage life cycle showing annual growth through three possible life cycle pathways: vegetative (whole plant survival); asexual persistence (turions); sexual (seed bank). (Source: Asanopoulos and Waycott, 2020).
17.3.1 Feedbacks to the Host Model
The habitat module has no feedbacks to the host hydrodynamic model.
17.3.2 Variable Summary
The diagnostic outputs able to be output are summarised in Table 17.1.
| AED name | Symbol | Description | Unit | Type | Typical Range | Comments |
|---|---|---|---|---|---|---|
| diag_level = ? | ||||||
HAB_RUPPIA_HSI_FSAL_1
|
\[\Phi^{adt}_{S}\] | HSI for adult growth based on salinity tolerance | benthic | 0 - 1 | ||
HAB_RUPPIA_HSI_FSAL_2
|
\[\Phi^{flw}_{S}\] | HSI for flowering based on salinity tolerance | benthic | 0 - 1 | ||
HAB_RUPPIA_HSI_FSAL_3
|
\[\Phi^{germ}_{S}\] | HSI for seed germination based on salinity tolerance | benthic | 0 - 1 | ||
HAB_RUPPIA_HSI_FSAL_4
|
\[\Phi^{tur}_{S}\] | HSI for turion formation based on salinity tolerance | benthic | 0 - 1 | ||
HAB_RUPPIA_HSI_FSAL_5
|
\[\Phi^{spr}_{S}\] | HSI for turion sprouting based on salinity tolerance | benthic | 0 - 1 | ||
HAB_RUPPIA_HSI_FSAL_6
|
\[\Phi^{via}_{S}\] | HSI for turion viability during dormancy based on salinity tolerance | benthic | 0 - 1 | ||
HAB_RUPPIA_HSI_FTEM_1
|
\[\Phi^{adt}_{T}\] | HSI for adult growth based on temperature tolerance | benthic | 0 - 1 | ||
HAB_RUPPIA_HSI_FTEM_2
|
\[\Phi^{flw}_{T}\] | HSI for flowering based on temperature tolerance | benthic | 0 - 1 | ||
HAB_RUPPIA_HSI_FTEM_3
|
\[\Phi^{germ}_{T}\] | HSI for seed germination based on temperature tolerance | benthic | 0 - 1 | ||
HAB_RUPPIA_HSI_FTEM_4
|
\[\Phi^{tur}_{T}\] | HSI for turion formation based on temperature tolerance | benthic | 0 - 1 | ||
HAB_RUPPIA_HSI_FTEM_5
|
\[\Phi^{spr}_{T}\] | HSI for turion sprouting based on temperature tolerance | benthic | 0 - 1 | ||
HAB_RUPPIA_HSI_FTEM_6
|
\[\Phi^{via}_{T}\] | HSI for turion viability during dormancy based on temperature tolerance | benthic | 0 - 1 | ||
HAB_RUPPIA_HSI_FLGT_1
|
\[\Phi^{adt}_{I}\] | HSI for adult growth based on light tolerance | benthic | 0 - 1 | ||
HAB_RUPPIA_HSI_FLGT_2
|
\[\Phi^{flw}_{I}\] | HSI for flowering based on light tolerance | benthic | 0 - 1 | ||
HAB_RUPPIA_HSI_FLGT_3
|
\[\Phi^{germ}_{I}\] | HSI for seed germination based on light tolerance | benthic | 0 - 1 | ||
HAB_RUPPIA_HSI_FLGT_4
|
\[\Phi^{tur}_{I}\] | HSI for turion formation based on light tolerance | benthic | 0 - 1 | ||
HAB_RUPPIA_HSI_FLGT_5
|
\[\Phi^{spr}_{I}\] | HSI for turion sprouting based on light tolerance | benthic | 0 - 1 | ||
HAB_RUPPIA_HSI_FLGT_6
|
\[\Phi^{via}_{I}\] | HSI for turion viability during dormancy based on light tolerance | benthic | 0 - 1 | ||
HAB_RUPPIA_HSI_FDEP_1
|
\[\Phi^{adt}_{D}\] | HSI for adult growth based on water depth tolerance | benthic | 0 - 1 | ||
HAB_RUPPIA_HSI_FDEP_2
|
\[\Phi^{flw}_{D}\] | HSI for flowering based on water depth tolerance | benthic | 0 - 1 | ||
HAB_RUPPIA_HSI_FDEP_3
|
\[\Phi^{germ}_{D}\] | HSI for seed germination based on water depth tolerance | benthic | 0 - 1 | ||
HAB_RUPPIA_HSI_FDEP_4
|
\[\Phi^{tur}_{D}\] | HSI for turion formation based on water depth tolerance | benthic | 0 - 1 | ||
HAB_RUPPIA_HSI_FDEP_5
|
\[\Phi^{spr}_{D}\] | HSI for turion sprouting based on water depth tolerance | benthic | 0 - 1 | ||
HAB_RUPPIA_HSI_FDEP_6
|
\[\Phi^{via}_{D}\] | HSI for turion viability during dormancy based on water depth tolerance | benthic | 0 - 1 | ||
HAB_RUPPIA_HSI_FALG_1
|
\[\Phi^{adt}_{A}\] | HSI for adult growth based on macroalgae presence | benthic | 0 - 1 | ||
HAB_RUPPIA_HSI_FALG_2
|
\[\Phi^{flw}_{A}\] | HSI for flowering based on macroalgae presence | benthic | 0 - 1 | ||
HAB_RUPPIA_HSI_FALG_3
|
\[\Phi^{germ}_{A}\] | HSI for seed germination based on macroalgae presence | benthic | 0 - 1 | ||
HAB_RUPPIA_HSI_FALG_4
|
\[\Phi^{tur}_{A}\] | HSI for turion formation based on macroalgae presence | benthic | 0 - 1 | ||
HAB_RUPPIA_HSI_FALG_5
|
\[\Phi^{spr}_{A}\] | HSI for turion sprouting based on macroalgae presence | benthic | 0 - 1 | ||
HAB_RUPPIA_HSI_FALG_6
|
\[\Phi^{via}_{A}\] | HSI for turion viability during dormancy based on macroalgae presence | benthic | 0 - 1 | ||
HAB_RUPPIA_HSI
|
benthic | 0 - 1 | ||||
HAB_RUPPIA_HSI_PLANT
|
benthic | 0 - 1 | ||||
HAB_RUPPIA_HSI_FLOWER
|
benthic | 0 - 1 | ||||
HAB_RUPPIA_HSI_SEED
|
benthic | 0 - 1 | ||||
HAB_RUPPIA_HSI_TURION
|
benthic | 0 - 1 | ||||
HAB_RUPPIA_HSI_SPROUT
|
benthic | 0 - 1 | ||||
HAB_RUPPIA_HSI_DORMANT
|
benthic | 0 - 1 | ||||
HAB_WETTIME
|
benthic | 0 - 1 | ||||
HAB_DRYTIME
|
benthic | 0 - 1 | ||||
17.3.3 Parameter Summary
The environmental thresholds and HSI functions used by this model are summarised in Table 17.2.
| Environmental condition (j) | Symbol | Threshold | HSI function - equations | HSI function - response curve | Source |
|---|---|---|---|---|---|
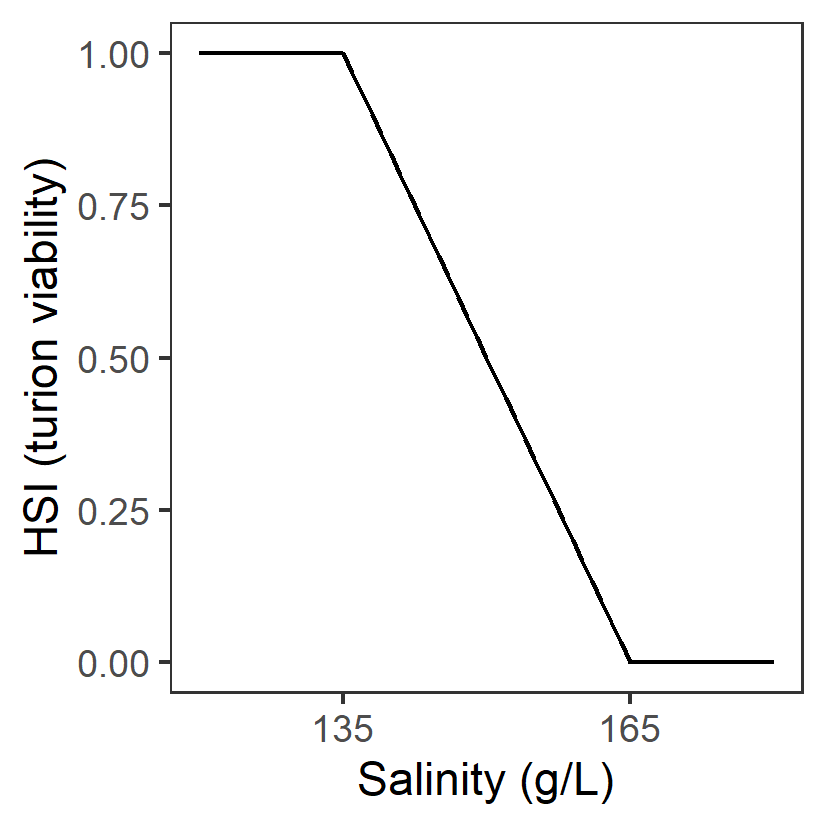
| Turion viability (Jan 1 – Mar 31) | |||||
| S: Salinity (g/L) | \(\Phi^{via}_{S}\) |
<135 optimal 135 – 165 suboptimal >=165 unsuitable |
\(\Phi^{via}_{S}\)= \[\begin{cases} 0, S\ge 165\\ 1-\frac{S-135}{165-135}, 135 \le S \lt 165 \\ 1, S \lt 135 \end{cases}\] |
|
Kim et al. (2013); Kim et al. (2015) |
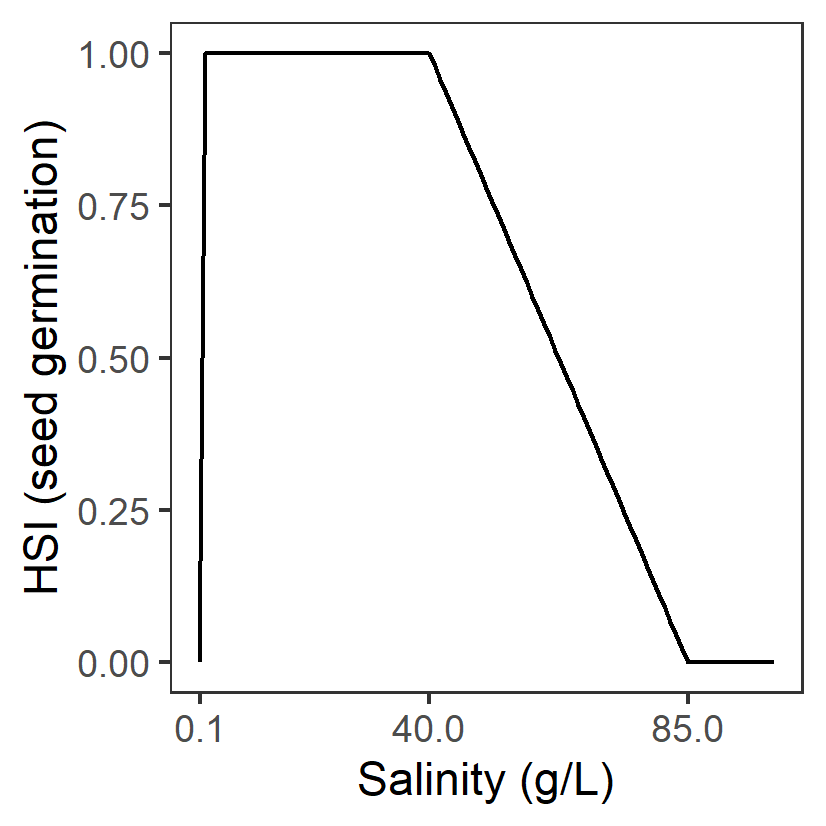
| Seed germination (Apr 1 – Jun 30) | |||||
| S: Salinity (g/L) | \(\Phi^{germ}_{S}\) |
<=0.1 unsuitable 0.1-40 optimal 40-85 suboptimal >85 unsuitable |
\(\Phi^{germ}_{S}\)= \[\begin{cases} 0, S\le 0.1 or S\gt 85\\ 1-\frac{S-40}{85-40}, 40 \le S \le 85 \\ 1, 0.1\lt S \lt 40 \end{cases}\] |
|
Kim et al. (2013) |
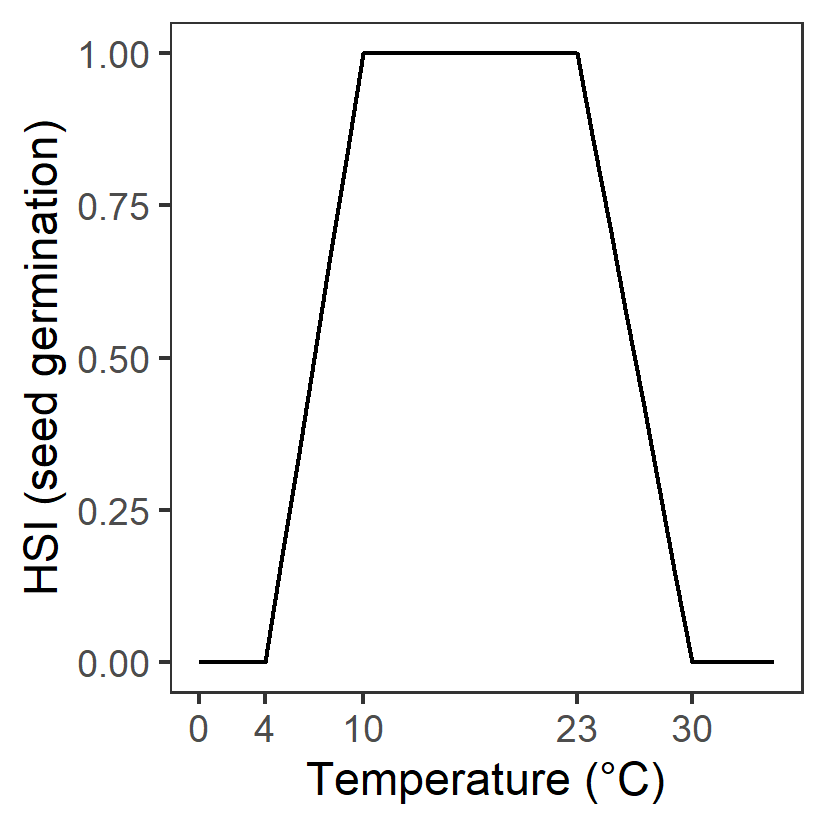
| T: Temperature (°C) | \(\Phi^{germ}_{T}\) |
<4 unsuitable 4-10 suboptimal 10-23 optimal 23-30 suboptimal >30 unsuitable |
\(\Phi^{germ}_{T}\)= \[\begin{cases} 0, T\le 4 or T\gt 30\\ \frac{T-4}{10-4}, 4 \lt T \le 10\\1-\frac{T-23}{30-23}, 23 \lt T \le 30 \\ 1,10\lt T \lt 23 \end{cases}\] |
|
Assumed to be the same as adult growth |
| D: Water depth (m) | \(\Phi^{germ}_{D}\) |
Permanent dry: unsuitable <15 days wet (>95% of time): unsuitable 15-42 days wet (>95% of time): suboptimal >42 days wet (>95% of time): optimal Permanently wet: optimal |
- | - | |
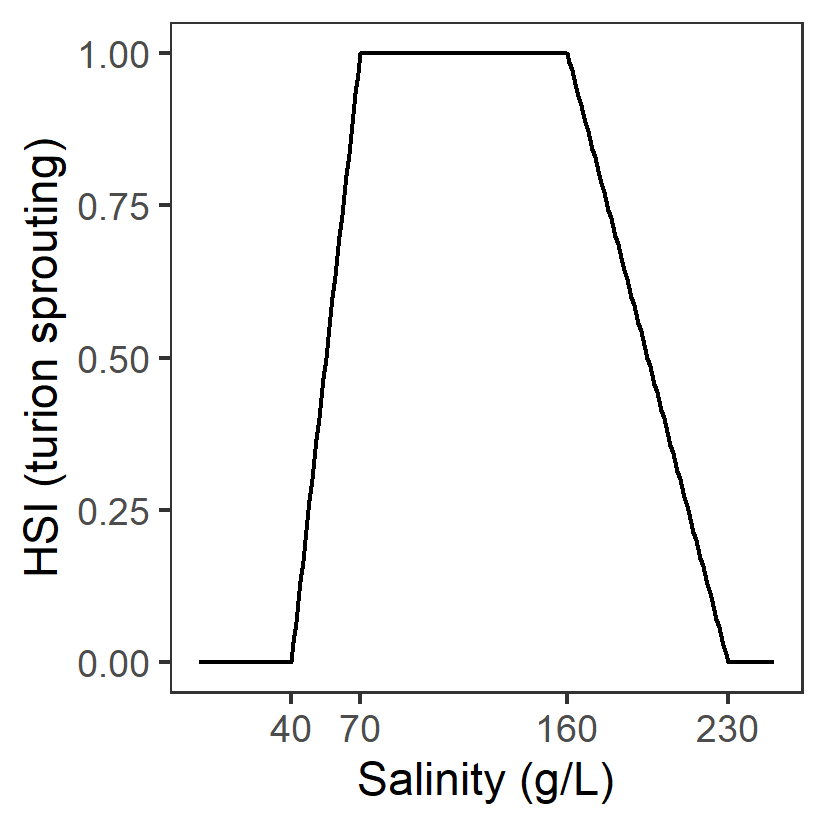
| Turion sprouting (Apr 1 – Jun 30) | |||||
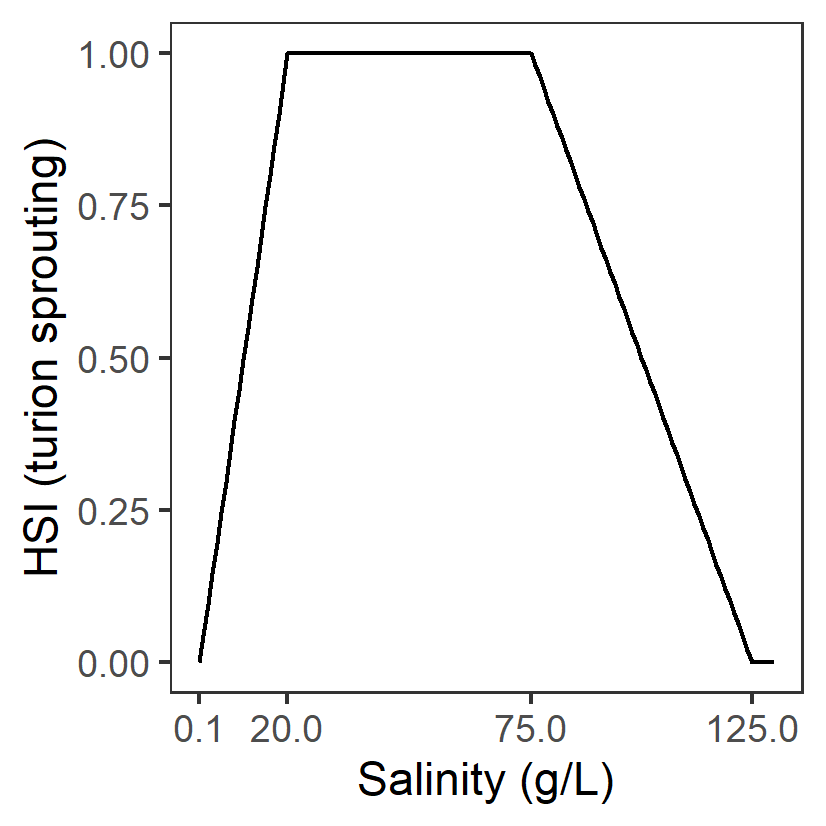
| S: Salinity (g/L) | \(\Phi^{spr}_{S}\) |
<=0.1 unsuitable 0.1-20 suboptimal 20-75 optimal 75-125 suboptimal >125 unsuitable |
\(\Phi^{spr}_{S}\)= \[\begin{cases} 0, S\le 0.1 or S\gt 125\\ \frac{S-0.1}{20-0.1}, 0.1 \lt S \le 20\\1-\frac{S-75}{125-75}, 75 \lt S \le 125 \\ 1,20\lt S \lt 75 \end{cases}\] |
|
Kim et al. (2013); Asanopoulos and Waycott (2020) Fig.5 |
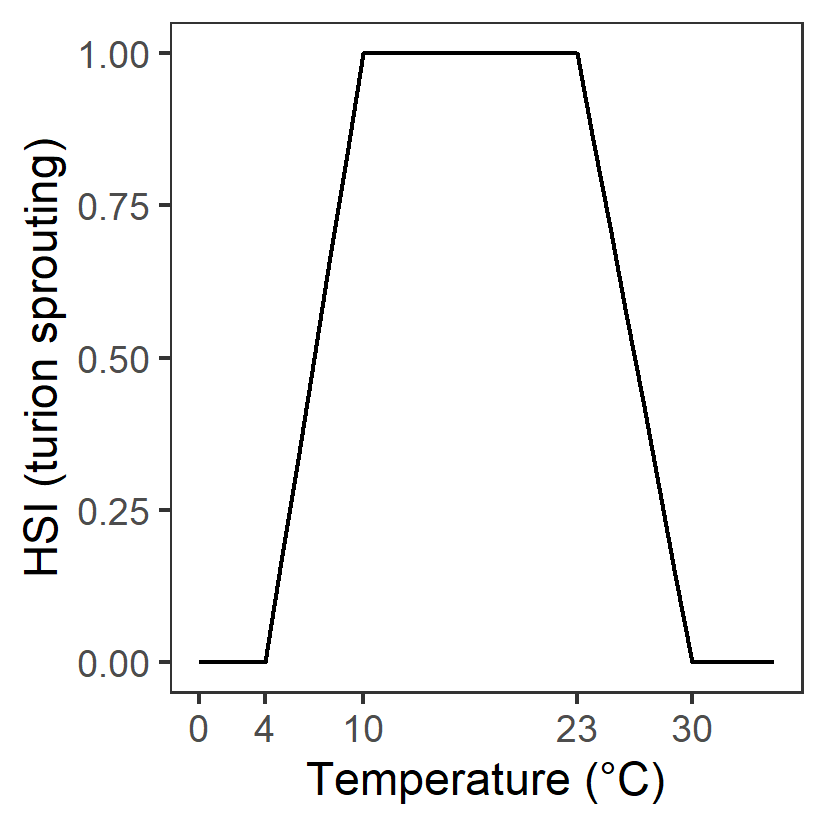
| T: Temperature (°C) | \(\Phi^{spr}_{T}\) |
<4 unsuitable 4-10 suboptimal 10-23 optimal 23-30 suboptimal >30 unsuitable |
\(\Phi^{spr}_{T}\)= \[\begin{cases} 0, T\le 4 or T\gt 30\\ \frac{T-4}{10-4}, 4 \lt T \le 10\\1-\frac{T-23}{30-23}, 23 \lt T \le 30 \\ 1,10\lt T \lt 23 \end{cases}\] |
|
Assumed to be the same as adult growth |
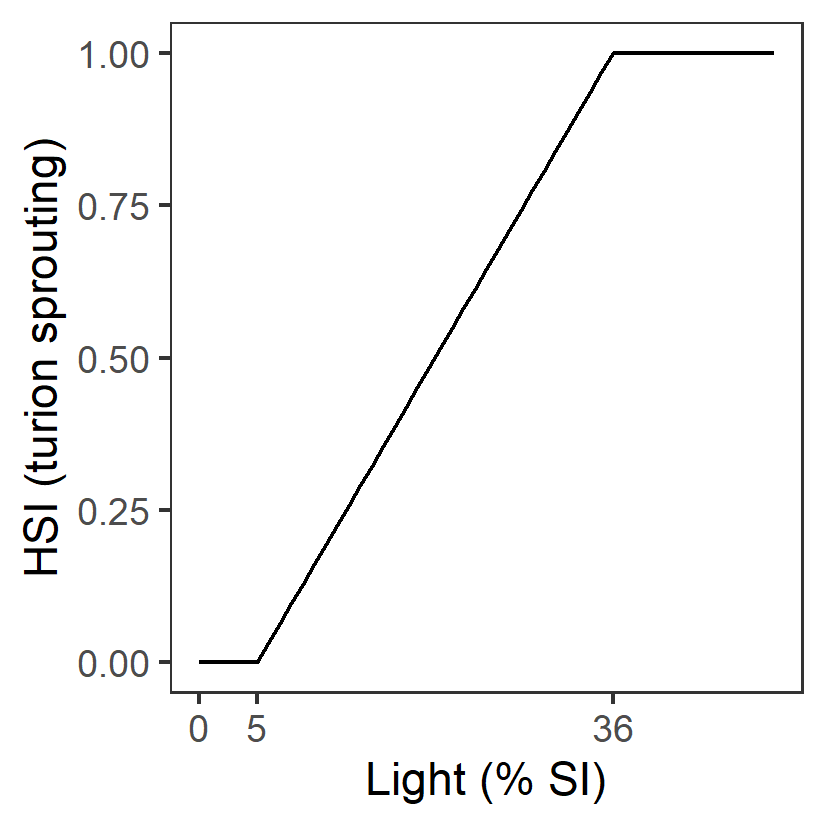
| L: Light (%SI) | \(\Phi^{spr}_{L}\) |
<=5 unsuitable 5-36 suboptimal >=36 optimal |
\(\Phi^{spr}_{L}\)= \[\begin{cases} 0, L\lt 5\\ \frac{L-5}{36-5}, 5 \le L \lt 36 \\ 1,L \gt 36 \end{cases}\] |
|
Assumed to be the same as adult growth |
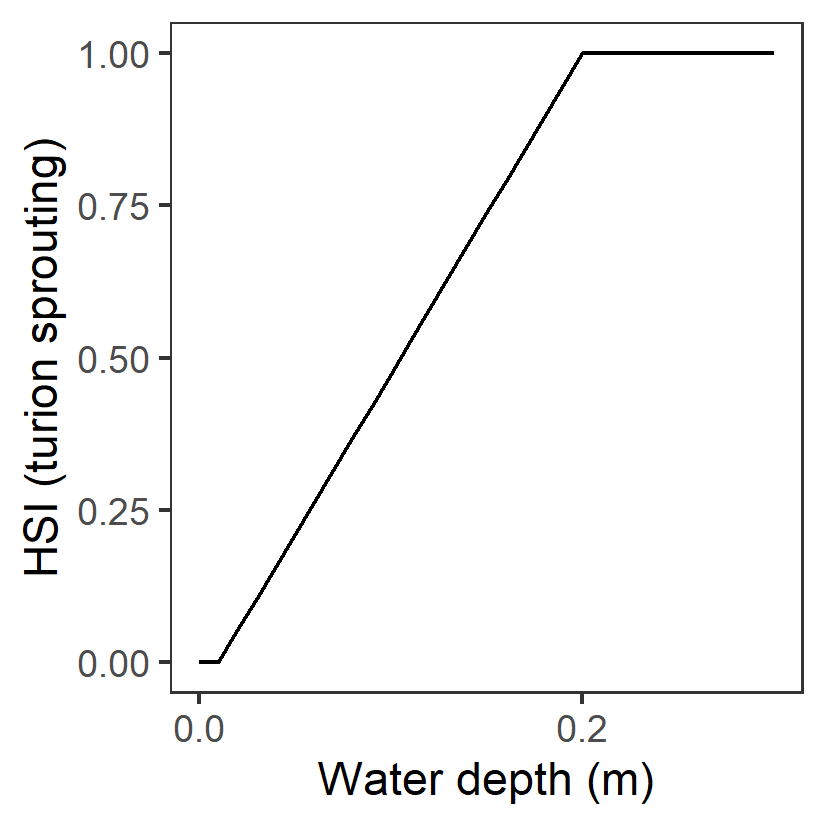
| D: Water depth (m) | \(\Phi^{spr}_{D}\) |
<=0.01 unsuitable 0.01-0.2 suboptimal >0.2 optimal |
\(\Phi^{spr}_{D}\)= \[\begin{cases} 0, D\lt 0.01\\ \frac{D-0.01}{0.2-0.01}, 0.01 \le D \lt 0.2 \\ 1,D \gt 0.2 \end{cases}\] |
|
Collier et al. (2017) |
| Adult plant growth (Jun 1 – Sep 30) | |||||
| S: Salinity (g/L) | \(\Phi^{adt}_{S}\) |
<10 unsuitable 10-19 suboptimal 19-124 optimal 124-230 suboptimal >230 unsuitable |
\(\Phi^{adt}_{S}\)= \[\begin{cases} 0, S\lt 10 or S\gt 230\\ \frac{S-10}{19-10}, 10 \le S \lt 19\\1-\frac{S-124}{230-124}, 124 \lt S \le 230\\ 1,19\le S \le 124 \end{cases}\] |
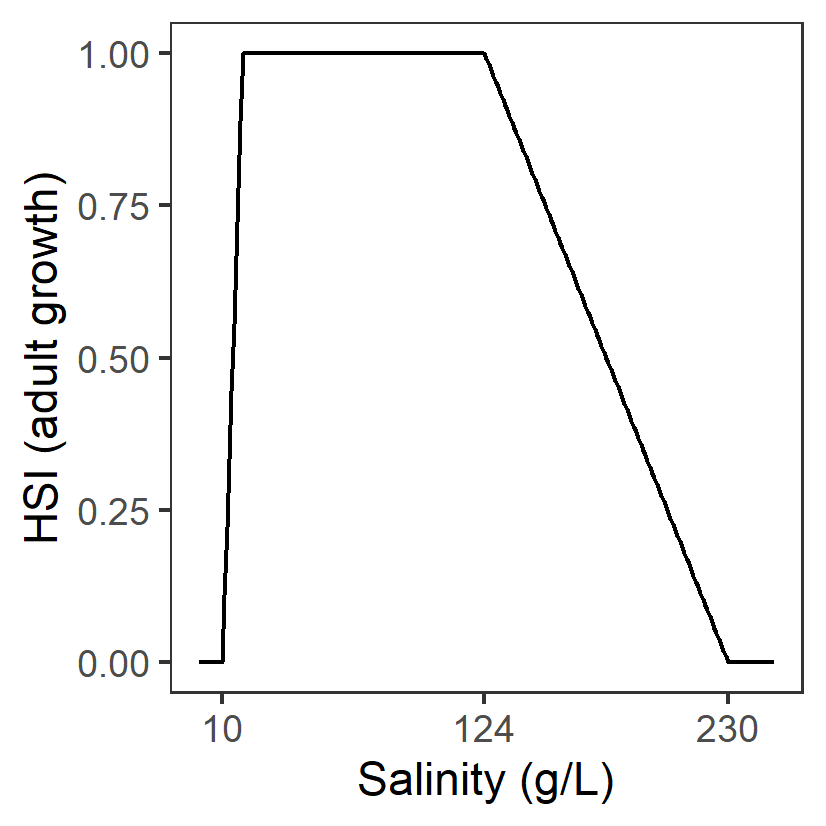
|
Brock (1982); Kim et al. (2015); Collier et al. (2017); Asanopoulos and Waycott (2020) |
| T: Temperature (°C) | \(\Phi^{adt}_{T}\) |
<4 unsuitable 4-10 suboptimal 10-23 optimal 23-30 suboptimal >30 unsuitable |
\(\Phi^{adt}_{T}\)= \[\begin{cases} 0, T\le 4 or T\gt 30\\ \frac{T-4}{10-4}, 4 \lt T \le 10\\1-\frac{T-23}{30-23}, 23 \lt T \le 30 \\ 1,10\lt T \lt 23 \end{cases}\] |

|
Santamarı́a and Hootsmans (1998) cited in Collier et al. (2017) |
| L: Light (%SI) | \(\Phi^{adt}_{L}\) |
<=5 unsuitable 5-36 suboptimal >=36 optimal |
\(\Phi^{adt}_{L}\)= \[\begin{cases} 0, L\lt 5\\ \frac{L-5}{36-5}, 5 \le L \lt 36 \\ 1,L \gt 36 \end{cases}\] |
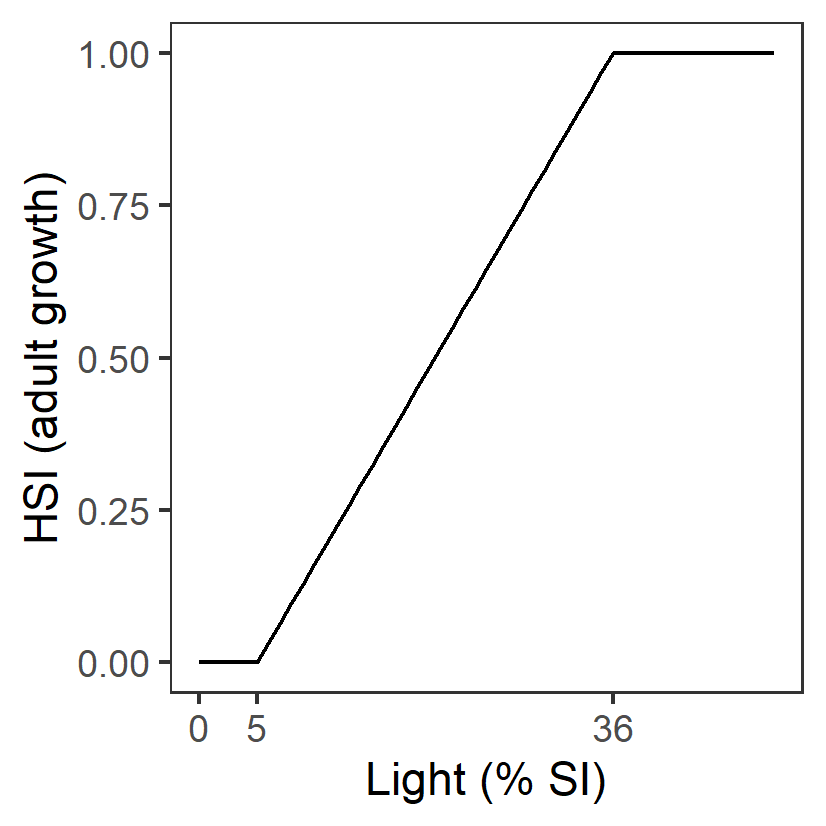
|
Collier et al. (2017) cited in Asanopoulos and Waycott (2020) |
| D: Water depth (m) | \(\Phi^{adt}_{D}\) |
< 10 % of time wet: unsuitable >= 10 % of time wet: suitable |
- | - |
Kim et al. (2015); Collier et al. (2017) |
| A: Algal biomass (g DW m-2) | \(\Phi^{adt}_{A}\) |
<=100 optimal 100-368 suboptimal >368 unsuitable |
\(\Phi^{adt}_{A}\)= \[\begin{cases} 0, A\gt 368\\ 1-\frac{A-100}{368-100}, 100 \lt A \le 368 \\ 1, A \le 100 \end{cases}\] |
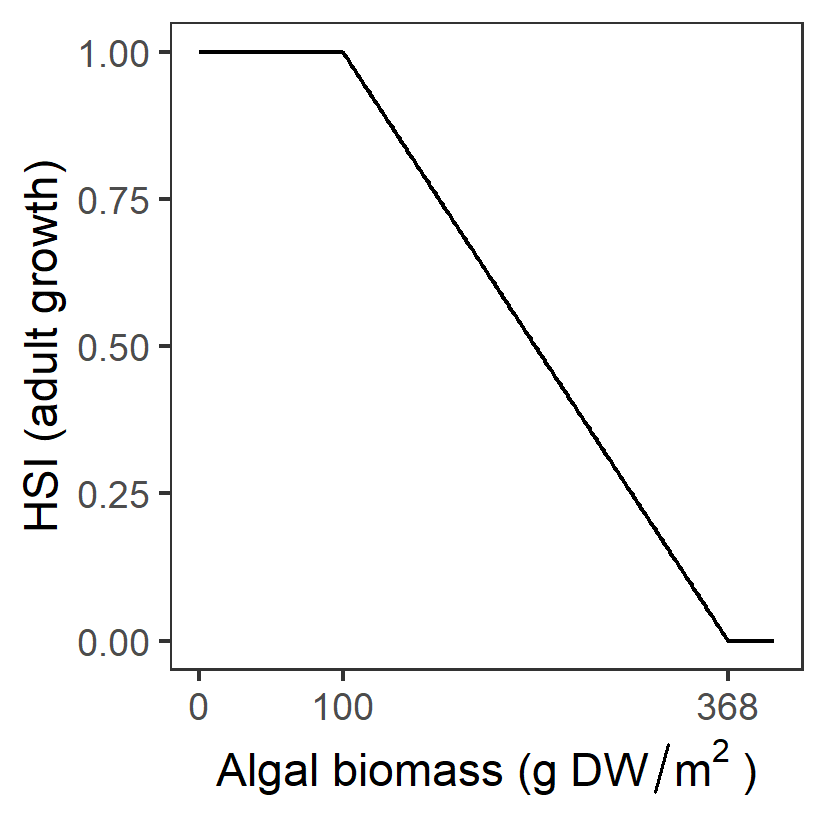
|
Lewis et al. (2022) |
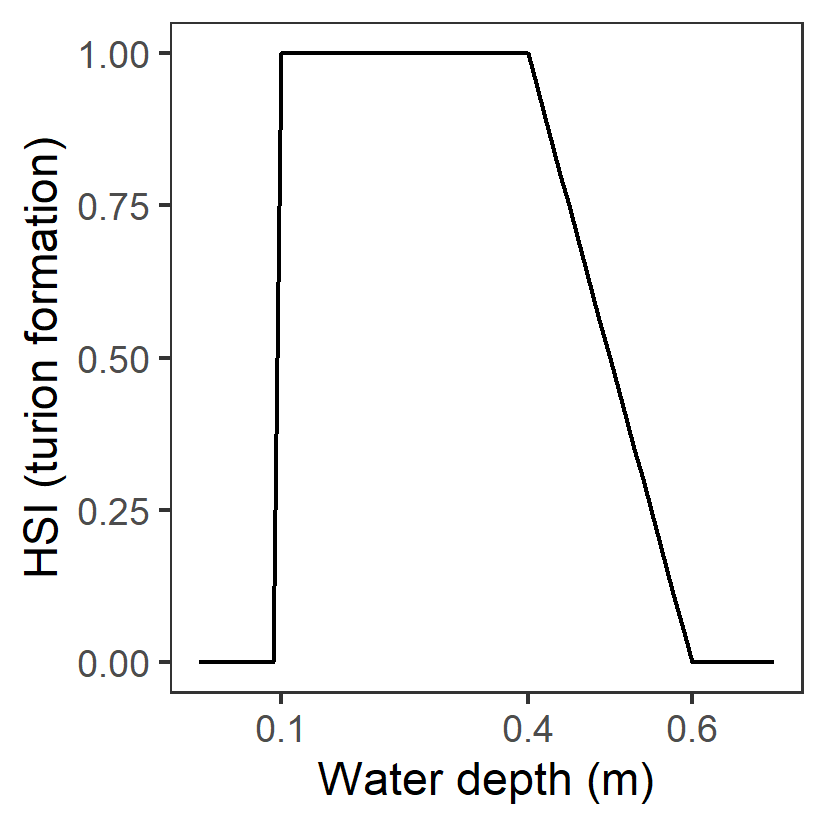
| Flowering and seed set (Sep 1 – Dec 31) | |||||
| S: Salinity (g/L) | \(\Phi^{flw}_{S}\) |
<12 unsuitable 12-47 suboptimal 47-62 optimal 62-100 suboptimal >100 unsuitable |
\(\Phi^{flw}_{S}\)= \[\begin{cases} 0, S\lt 47 or S\gt 100\\ \frac{S-12}{47-12}, 12 \le S \lt 47\\1-\frac{S-62}{100-62}, 62 \lt S \le 100\\ 1,47\le S \le 62 \end{cases}\] |
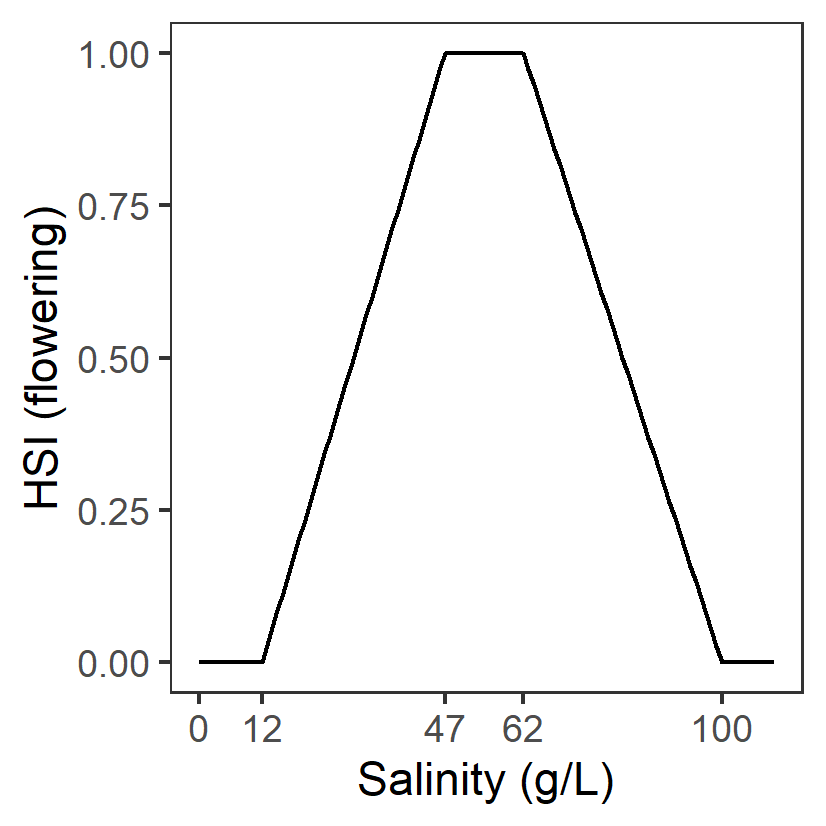
|
Kim et al. (2015); Collier et al. (2017); Asanopoulos and Waycott (2020) |
| T: Temperature (°C) | \(\Phi^{flw}_{T}\) |
<4 unsuitable 4-10 suboptimal 10-23 optimal 23-30 suboptimal >30 unsuitable |
\(\Phi^{flw}_{T}\)= \[\begin{cases} 0, T\le 4 or T\gt 30\\ \frac{T-4}{10-4}, 4 \lt T \le 10\\1-\frac{T-23}{30-23}, 23 \lt T \le 30 \\ 1,10\lt T \lt 23 \end{cases}\] |
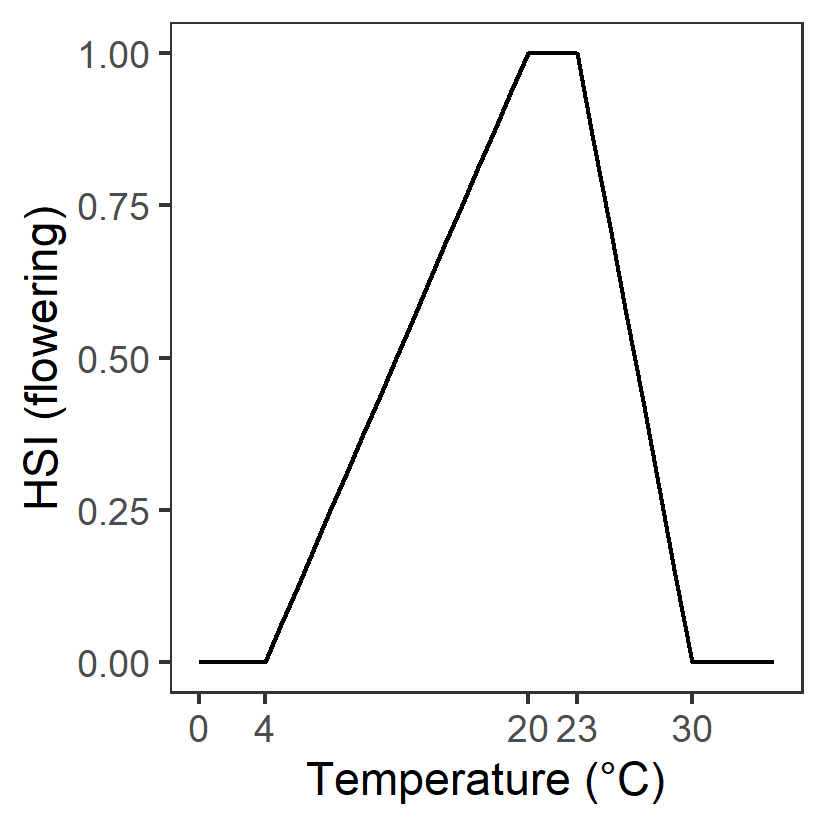
|
Assumed to be the same as adult growth |
| L: Light (%SI) | \(\Phi^{flw}_{L}\) |
<=5 unsuitable 5-36 suboptimal >=36 optimal |
\(\Phi^{flw}_{L}\)= \[\begin{cases} 0, L\lt 5\\ \frac{L-5}{36-5}, 5 \le L \lt 36 \\ 1,L \gt 36 \end{cases}\] |
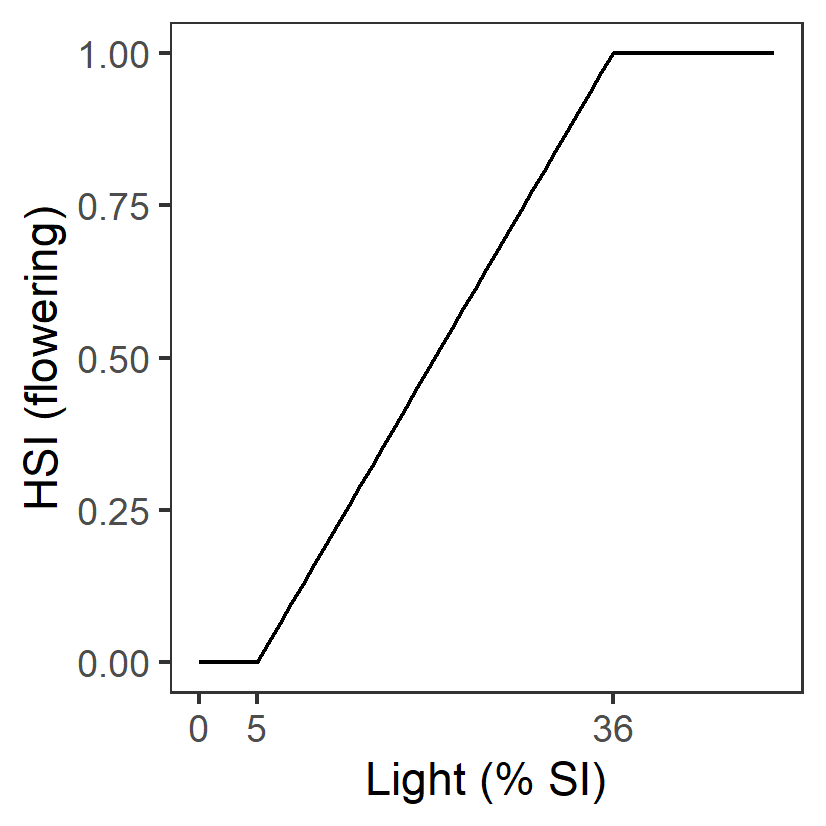
|
Assumed to be the same as adult growth |
| D: Water depth (m) | \(\Phi^{flw}_{D}\) |
<0.01 unsuitable 0.01-0.1 suboptimal 0.1-0.4 optimal 0.4-0.9 suboptimal >0.9 unsuitable |
\(\Phi^{flw}_{D}\)= \[\begin{cases} 0, D\le 0.01 or T\gt 0.9\\ \frac{D-0.01}{0.1-0.01}, 0.01 \lt D \le 0.1\\1-\frac{D-0.4}{0.9-0.4}, 23 \lt D \le 0.9 \\ 1,10\lt D \lt 0.4 \end{cases}\] |
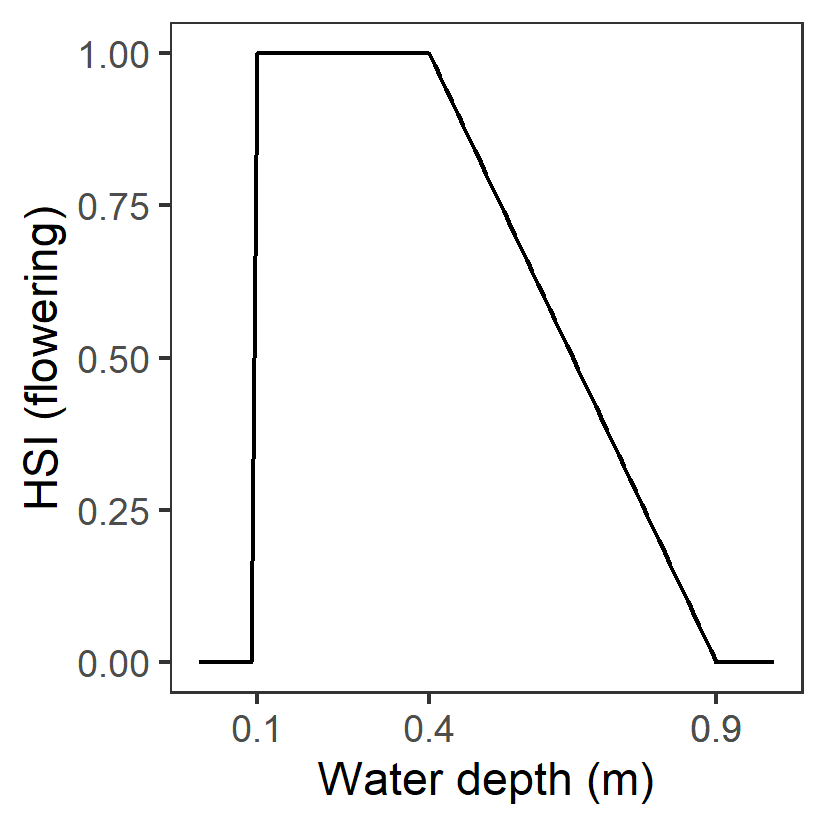
|
Kim et al. (2015); Collier et al. (2017); |
| A: Algal biomass (g DW m-2) | \(\Phi^{flw}_{A}\) |
<=100 optimal 100-184 suboptimal >184 unsuitable |
\(\Phi^{flw}_{A}\)= \[\begin{cases} 0, A\gt 184\\ 1-\frac{A-100}{184-100}, 100 \lt A \le 184 \\ 1, A \le 100 \end{cases}\] |
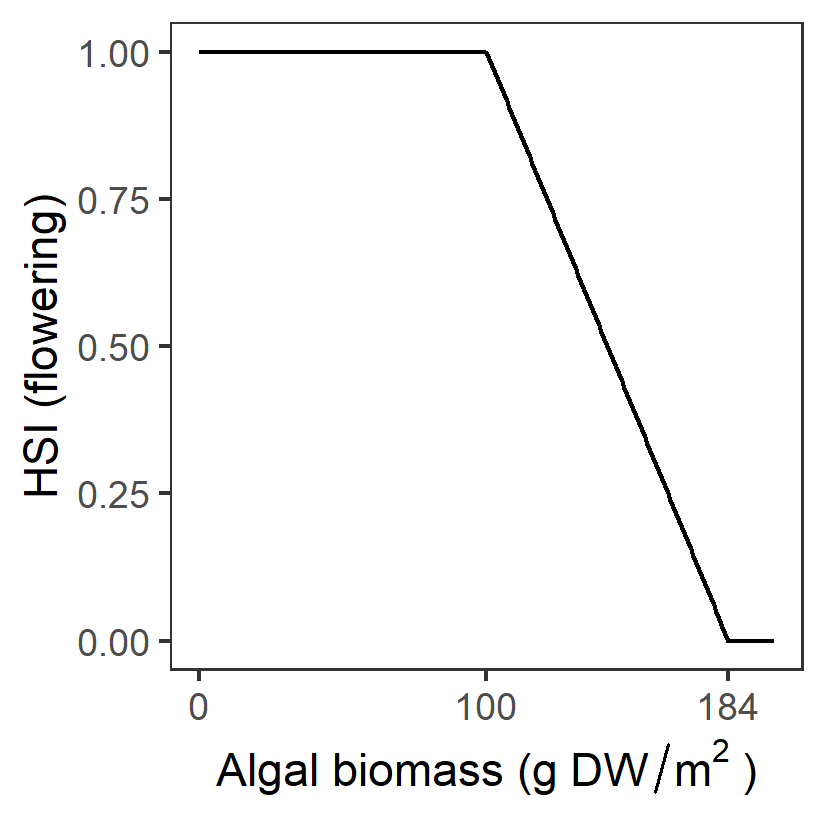
|
Lewis et al. (2022) |
| Turion formation (Sep 1 – Dec 31) | |||||
| S: Salinity (g/L) | \(\Phi^{tur}_{S}\) |
<40 unsuitable 40-70 suboptimal 70-160 optimal 160-230 suboptimal >230 unsuitable |
\(\Phi^{tur}_{S}\)= \[\begin{cases} 0, S\lt 40 or S\gt 230\\ \frac{S-40}{70-40}, 40 \le S \lt 70\\1-\frac{S-160}{230-160}, 160 \lt S \le 230\\ 1,70\le S \le 160 \end{cases}\] |
|
Kim et al. (2015); Asanopoulos and Waycott (2020) |
| T: Temperature (°C) | \(\Phi^{tur}_{T}\) |
<4 unsuitable 4-10 suboptimal 10-23 optimal 23-30 suboptimal >30 unsuitable |
\(\Phi^{tur}_{T}\)= \[\begin{cases} 0, T\le 4 or T\gt 30\\ \frac{T-4}{10-4}, 4 \lt T \le 10\\1-\frac{T-23}{30-23}, 23 \lt T \le 30 \\ 1,10\lt T \lt 23 \end{cases}\] |
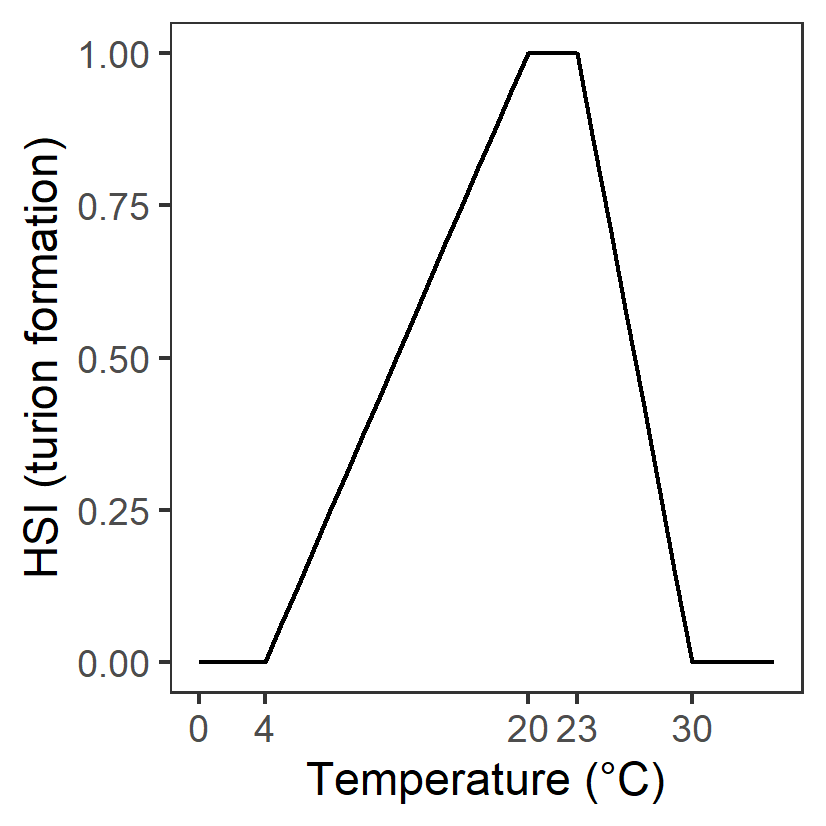
|
Assumed to be the same as adult growth |
| L: Light (%SI) | \(\Phi^{tur}_{L}\) |
<=5 unsuitable 5-36 suboptimal >=36 optimal |
\(\Phi^{tur}_{L}\)= \[\begin{cases} 0, L\lt 5\\ \frac{L-5}{36-5}, 5 \le L \lt 36 \\ 1,L \gt 36 \end{cases}\] |
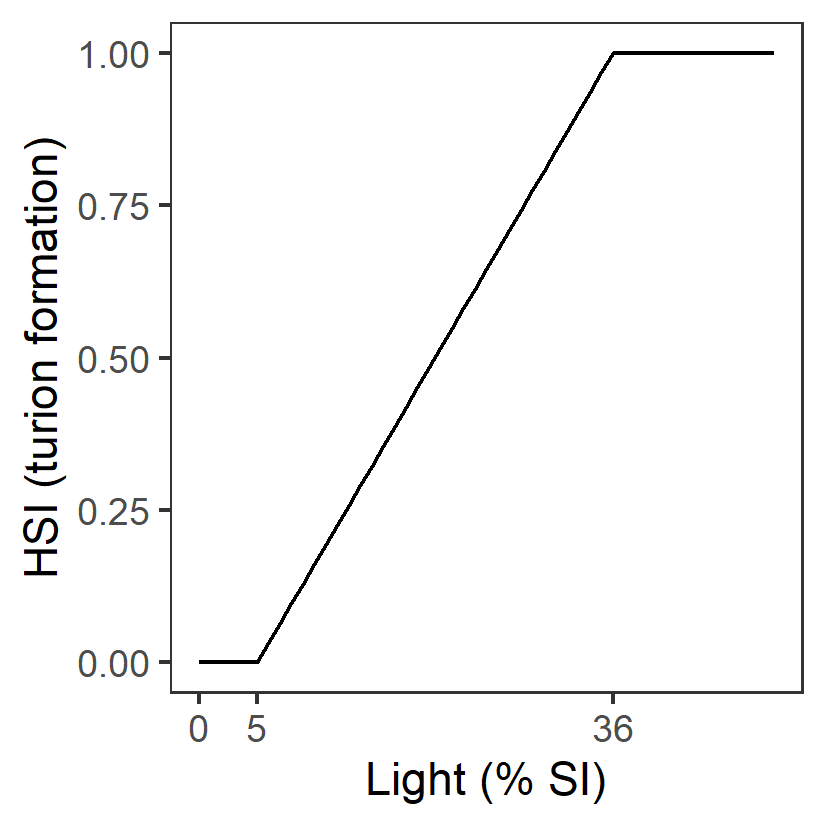
|
Assumed to be the same as adult growth |
| D: Water depth (m) | \(\Phi^{tur}_{D}\) |
< 10 % of time wet: unsuitable >= 10 % of time wet: suitable |
- |
|
|
17.3.4 Post-processing
The Habitat Suitability Index (HSI) computed at each time step (\(t\)) in the habitat module can be integrated over a time window, specific to the Ruppia’s life stage.
\[ \Phi^{HSI_{j}}_{i} = \frac{1}{t_{j_{\text{start}}}-t_{j_{\text{end}}}} \sum^{t_{j_{\text{end}}}}_{t=t_{j_{\text{start}}}}\Phi^{HSI_{j}}_{i}(i)_{t} \tag{17.1} \\ \scriptsize{ \\ \text{whereby: $i$ = {salinity, temperature, light, depth, algae}} \\ \text{and: $j$ = {turion viability, seed germination, turion sprouting, adult growth, flowering, turion formation}}} \]
The integration time for each life-stage, \(j\), is selected from within the available plant growth windows, as indicated in Table 17.3.
| Life-stage, \(j\) | Turion viability | Seed germination/Turion sprouting | Adult growth | Flowering/Turion formation |
|---|---|---|---|---|
| Start date, \(t_{jstart}\) | Jan 1 | Apr 1 | Jun 1 | Sep 1 |
| End date, \(t_{jend}\) | Mar 31 | Jun 30 | Sep 30 | Dec 31 |
The above function is computed in each cell and produces maps of
suitability for each environmental attribute for each life stage within
any given year. These are then overlaid to produce a final map for any
given year for:
An overall HSI sexual, representing the integrated habitat suitability for Ruppia to complete its annual life cycle by reproducing sexually, i.e., flowering, which includes i) emerging in autumn, either from germination from seed or sprouting from viable turions that survived the summer; ii) vegetative growth to adult plants in winter; and iii) successful flowering and producing seed in spring; or
An overall HSI asexual, representing the integrated habitat suitability for Ruppia to complete its annual life cycle by reproducing asexually, i.e., forming turions, which includes i) emerging in autumn, either from germination from seed or sprouting from viable turions that survived the summer; ii) vegetative growth to adult plants in winter; and iii) formation of turions in spring. Specifically:
\[ \Phi^{HSI sexual}_{c} = \text{min}\left[\text{max}\left[\Phi^{HSI_{seed}}_{i},\text{min}\left[\Phi^{HSI_{viability}}_{i},\Phi^{HSI_{sprout}}_{i}\right]\right],\Phi^{HSI_{adult}}_{i},\Phi^{HSI_{flower}}_{i}\right]_{c} \tag{17.2} \]
\[ \Phi^{HSI asexual}_{c} = \text{min}\left[\text{max}\left[\Phi^{HSI_{seed}}_{i},\text{min}\left[\Phi^{HSI_{viability}}_{i},\Phi^{HSI_{sprout}}_{i}\right]\right],\Phi^{HSI_{adult}}_{i},\Phi^{HSI_{turion}}_{i}\right]_{c} \tag{17.3} \]
To compare the overall area of suitable habitat between years, or the
relative suitability of alternate scenarios, the fractional suitability
is used as a multiplier with the cell area, according to:
\[ A^{HSI} = \sum_{c} \Phi^{HSI}_{c} A_{c} \tag{17.4} \]
and the spatially averaged HSI in any given region (with area A) is
computed as:
\[ \overline{HSI} = \frac{1}{A}\sum_{c} \Phi^{HSI}_{c} A_{c} \tag{17.5} \]
17.4 Setup & Configuration
An example aed.nml parameter specification block for the aed_habitat
module is shown below:
&aed_habitat_benthic
    simRuppiaHabitat  = 2
    diag_level  =  3
    rhsi_falg_link  = 'MAG_ulva_a_ben'
    rhsi_salg_link  = 'MAG_ulva_c'
/
17.5 Case Studies & Examples
17.5.1 Case Study
The Ruppia Habitat model was applied to the Coorong Lagoon in South Australia. The Coorong Lagoon is a hypersaline system situated at the end of the Murray-Darling basin and a Ramsar Wetland of international importance (Figure 17.2). The growth of the keystone seagrass species Ruppia tuberosa in this system is influenced by environmental factors such as salinity, water level, light availability, temperature and macroalgae presence.Figure 17.2: Map of the Coorong Lagoon in South Australia.
The hydrodynamic-biogeochemical model TUFLOW-FV was coupled
with AED to simulate the hydrodynamic conditions (velocity, salinity,
temperature and water level), water clarity (light and turbidity) and
the potential for filamentous algae (nutrients and algae). Outputs were
used to assess habitat quality for various life-stages of Ruppia in
the aed_habitat module (examples are shown in Figure 17.3 and Figure 17.4. Refer to CDM manual
for details of the study.
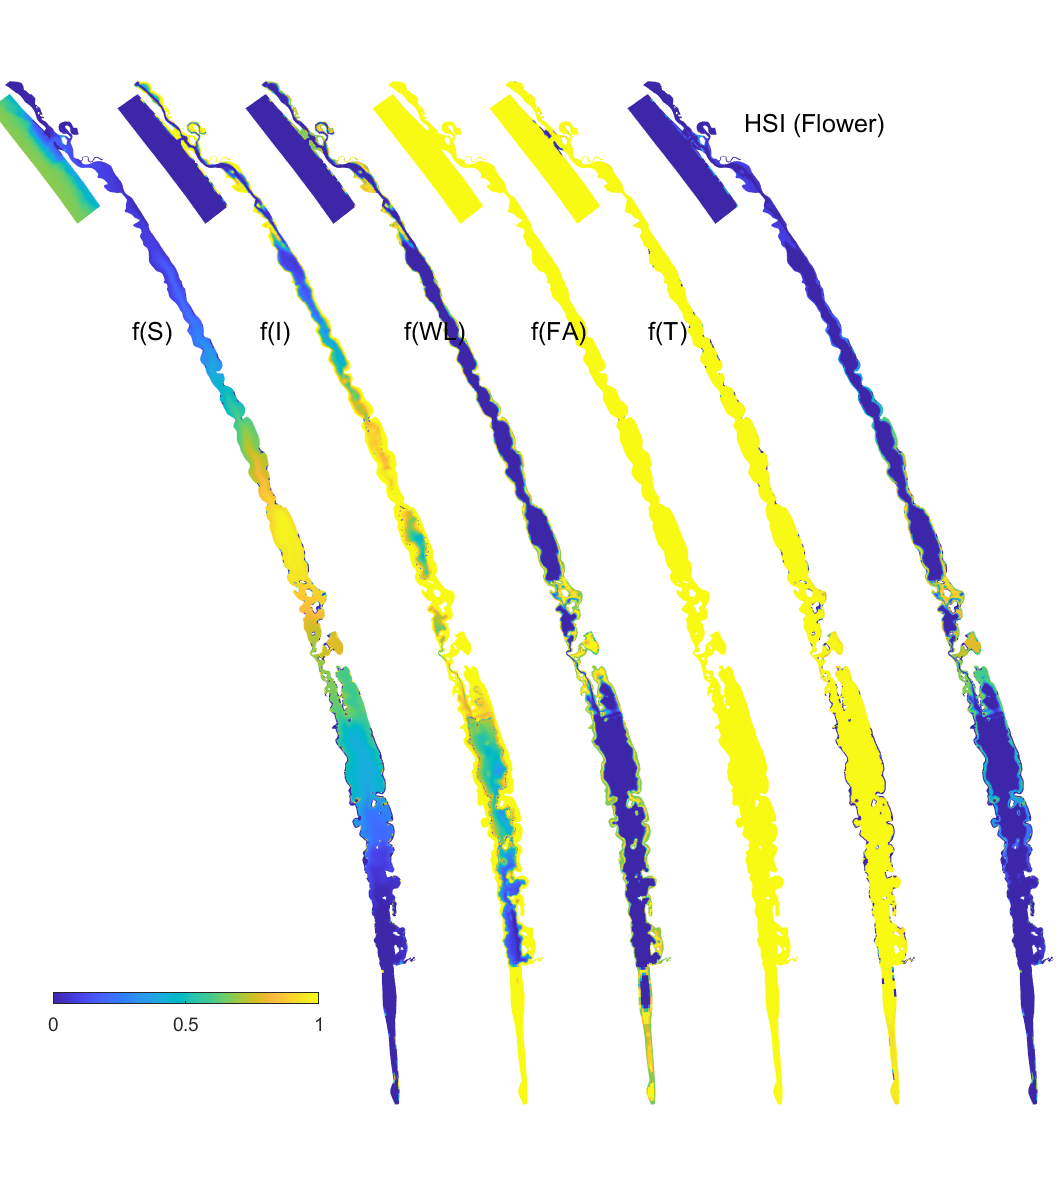
Figure 17.3: Habitat suitability (HSI) for the flowering plant phase of Ruppia tuberosa in the Coorong as a function of salinity f(S), light f(l), water level f(WL), temperature f(T) and presence of filamentous algae f(FA) for the base case in 2020. An HSI of 0 (dark purple) represents unsuitable habitat conditions, while an HSI of 1 represents optimal conditions (yellow).
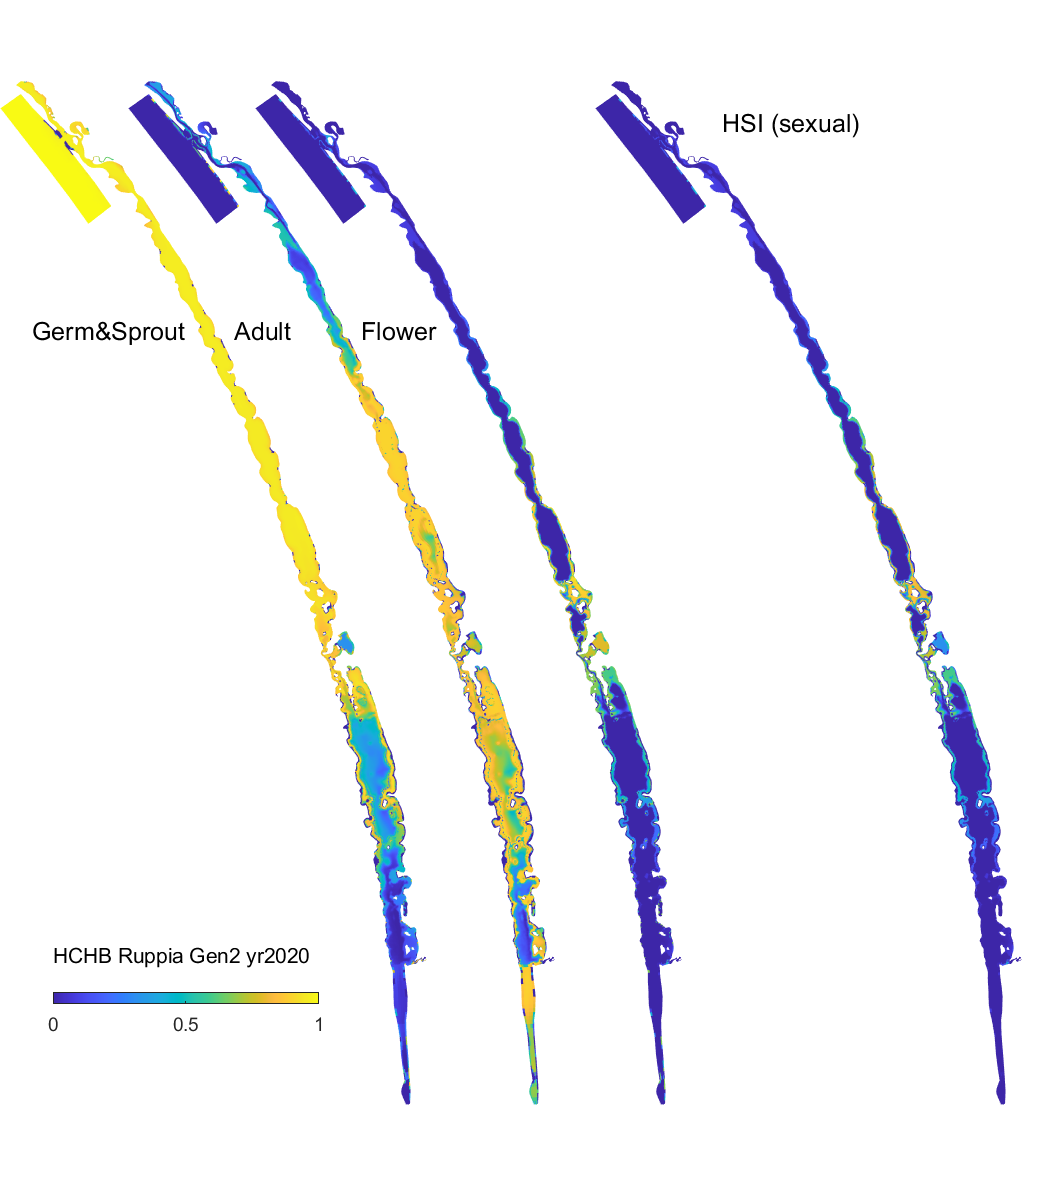
Figure 17.4: Overall HSI for the successful completion of the sexual life cycle calculated by integrating the HSI results for seed germination, turion viability and turion sprouting, adult plants, and flowering and seed set in the Coorong, for the Base Case in 2020. An HSI of 0 (dark purple) represents unsuitable habitat conditions, while an HSI of 1 represents optimal conditions (yellow).
17.5.2 Publications
| Author/Year | Paper Title | Description |
|---|---|---|
| Brookes et al. (2022) | Environmental flows to estuaries and coastal lagoons shape the salinity gradient and generate suitable fish habitat: Predictions from the Coorong, Australia | Estuarine |